reentering TOMO tradeNow my others have closed TOMO is looking good, especially with the BTC leg up, going to ride it to the monthly
TOMOBULLUSD trade ideas
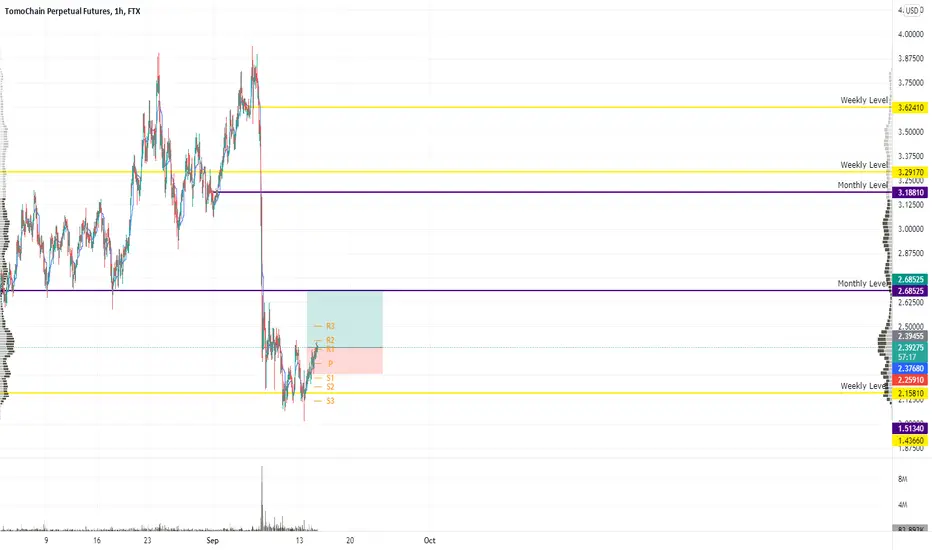
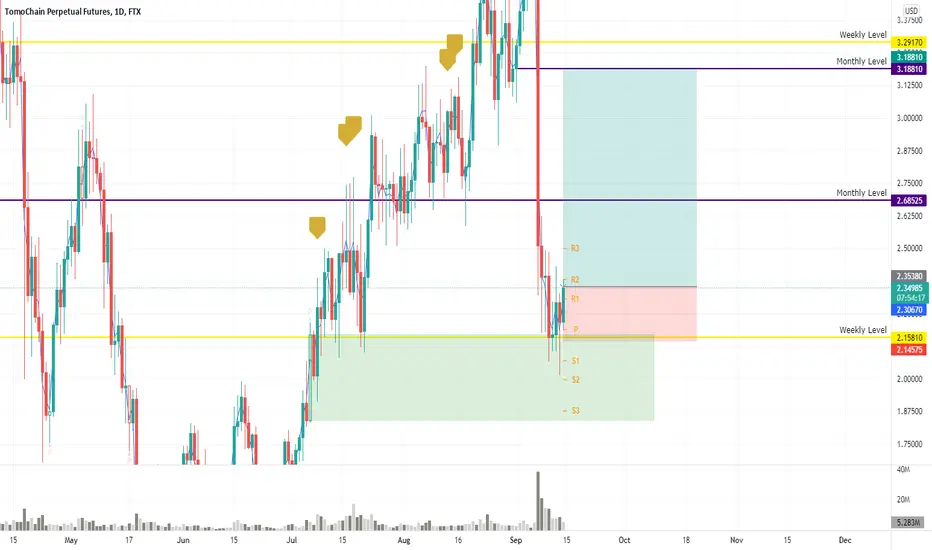
TOMO time to golet's see how this trade works out, using the weekly for support and the monthlys for TPs
TomoChain Watch out!will probably drop more in the coming days. The diagonal must hold to continue the bull run
I hope you found the idea interesting:)

More Bats; Bearish Bats Everywhere!!I have found yet another Bearish Bat within the crypto market this one looks really nice lets see how well it performs.

TOMO Idea - For the BullsTOMOUSD showing a potential repeating pattern
leading to a massive channel breakout which would be nice
The pattern (1) has repeated itself, so I assume the next structure will repeat itself
It is a big assumption, but the bulls are favored so the chart will probably spit out something like that
Lets go TOMO!


TOMOUSD D4: 800% gains BEST LEVEL TO BUY/HOLD(SL/TP)(UPDATED)Why get subbed to me on Tradingview?
-TOP author on TradingView
-15+ years experience in markets
-Professional chart break downs
-Supply/Demand Zones
-TD9 counts / combo review
-Key S/R levels
-No junk on my charts
-Frequent updates
-Covering FX/crypto/US stocks
-24/7 uptime so constant updates
TOMOUSD D4: 800% gains BEST LEVEL TO BUY/HOLD(SL/TP)(UPDATED)
IMPORTANT NOTE: speculative setup. do your own
due dill. use STOP LOSS. don't overleverage.
READ ENTIRE IDEA BEFORE EXECUTING.
🔸 Summary and potential trade setup
::: TOMOUSD 4days/candle chart review
::: updated outlook still valid today
::: CORRECTION MODE next 4-8 weeks
::: correction just started not OVER
::: chart is LOG SCALE
::: get ready to BUY LOW later
::: BUY LOW near 70c
::: entry - after 50% CORRECTION
::: up to 800% gains possible later
::: short-term pullback/correction
::: correction/pullback NOW
::: however chart looks strong
::: SPECULATIVE SETUP
::: do your own due dill
::: and use proper risk management
::: TP bulls is +800% gains
::: details: see chart
::: FINAL TP is 800% gains
::: recommended strategy: BUY/HOLD after pullback
::: TP BULLS +800% gains
::: SWING TRADE: BUY/HOLD IT
::: bull run not over yet
::: good luck traders!
::: BUY/HOLD and get paid. period.
🔸 Supply/Demand Zones
::: N/A
::: N/A
🔸 Other noteworthy technicals/fundies
::: TD9 /Combo update: N/A
::: Sentiment mid-term: BEARS/CORRECTION
::: Sentiment short-term: PULLBACK/CORRECTION NOW
RISK DISCLAIMER:
Trading Crypto, Futures , Forex, CFDs and Stocks involves a risk of loss.
Please consider carefully if such trading is appropriate for you.
Past performance is not indicative of future results.
Always limit your leverage and use tight stop loss.

TOMOUSD D4: 800% gains BEST LEVEL TO BUY/HOLD(SL/TP)(NEW)Why get subbed to me on Tradingview?
-TOP author on TradingView
-15+ years experience in markets
-Professional chart break downs
-Supply/Demand Zones
-TD9 counts / combo review
-Key S/R levels
-No junk on my charts
-Frequent updates
-Covering FX/crypto/US stocks
-24/7 uptime so constant updates
TOMOUSD D4: 800% gains BEST LEVEL TO BUY/HOLD(SL/TP)(NEW)
IMPORTANT NOTE: speculative setup. do your own
due dill. use STOP LOSS. don't overleverage.
READ ENTIRE IDEA BEFORE EXECUTING.
🔸 Summary and potential trade setup
::: TOMOUSD 4days/candle chart review
::: CORRECTION MODE next 4-8 weeks
::: correction just started not OVER
::: chart is LOG SCALE
::: get ready to BUY LOW later
::: BUY LOW near 70c
::: entry - after 50% CORRECTION
::: up to 800% gains possible later
::: short-term pullback/correction
::: correction/pullback NOW
::: however chart looks strong
::: SPECULATIVE SETUP
::: do your own due dill
::: and use proper risk management
::: TP bulls is +800% gains
::: details: see chart
::: FINAL TP is 800% gains
::: recommended strategy: BUY/HOLD after pullback
::: TP BULLS +800% gains
::: SWING TRADE: BUY/HOLD IT
::: bull run not over yet
::: good luck traders!
::: BUY/HOLD and get paid. period.
🔸 Supply/Demand Zones
::: N/A
::: N/A
🔸 Other noteworthy technicals/fundies
::: TD9 /Combo update: N/A
::: Sentiment mid-term: BEARS/CORRECTION
::: Sentiment short-term: PULLBACK/CORRECTION NOW
RISK DISCLAIMER:
Trading Crypto, Futures , Forex, CFDs and Stocks involves a risk of loss.
Please consider carefully if such trading is appropriate for you.
Past performance is not indicative of future results.
Always limit your leverage and use tight stop loss.


TOMOUSD D4: 685% gains THE BEST LEVEL TO BUY/HOLD(SL/TP)(NEW)Why get subbed to me on Tradingview?
-TOP author on TradingView
-15+ years experience in markets
-Professional chart break downs
-Supply/Demand Zones
-TD9 counts / combo review
-Key S/R levels
-No junk on my charts
-No MACD / RSI /MA/FIBONACCI
-Frequent updates
-Covering FX/crypto/US stocks
-24/7 uptime so constant updates
-no moonboy/crazy targets
-TA that makes sense and
-setups that payout
TOMOUSD D4: 685% gains THE BEST LEVEL TO BUY/HOLD(SL/TP)(NEW)
IMPORTANT NOTE: speculative setup. do your own
due dill. use STOP LOSS. don't overleverage.
🔸 Summary and potential trade setup
::: TOMOUSD 4days/candle chart review
::: accumulation in progress now
::: bullish 5 waves sequence
::: updated/revised outlook
::: setup still valid as of today
::: chart is LOG SCALE
::: get ready to BUY LOW later
::: BUY LOW near 1.87
::: currently in WAVE3 of the sequence
::: expecting WAVE4 correction soon
::: will last 4-6 weeks
::: up to 685% gains possible later
::: short-term pullback/correction
::: wave4 correction/pullback SOON
::: however chart looks strong
::: SPECULATIVE SETUP
::: do your own due dill
::: and use proper risk management
::: TP bulls is +685% gains
::: details: see chart
::: FINAL TP is 13-14 USD
::: recommended strategy: BUY/HOLD after pullback
::: TP BULLS +685% gains
::: SWING TRADE: BUY/HOLD IT
::: bull run not over yet
::: good luck traders!
::: BUY/HOLD and get paid. period.
🔸 Supply/Demand Zones
::: N/A
::: N/A
🔸 Other noteworthy technicals/fundies
::: TD9 /Combo update: N/A
::: Sentiment mid-term: BULLS
::: Sentiment short-term: PULLBACK/WAVE4
RISK DISCLAIMER:
Trading Crypto, Futures , Forex, CFDs and Stocks involves a risk of loss.
Please consider carefully if such trading is appropriate for you.
Past performance is not indicative of future results.
Always limit your leverage and use tight stop loss.


TOMOUSDI see big UP move. It is just my opinion. Let we see how big it will be.
Good luck with your trade!!

TOMO/USD prediction for April-MayHey there! A little prediction for TOMO/USD and what might happen to it in the next month or so... The Red line shows the Stop loss, the black arrows form a chain showing another idea that shows how the bumps form the pattern of 3 and then an average for long. The green line with the numerical order shows the average that it will form, but the dips are not mentioned in that average idea. The Target 1, 2 and 3 are for sure but the dates for that are not accurate. 2-3 months will prove the targets correct. The stop loss is not going lower than 0.8 $ for sure. CHECK THE GRAPH FOR A GOOD UNDERSTANDING!!
NOT A FINANCIAL ADVICE!!!!!!


TOMO - $6.88TOMO is currently trading above the 0.618 fib at $2.60. It has a decent support at $2.26 which is the 0.382 fib and a strong support at $2.13. All these 3 areas are buy zones and you can DCA your entries at these levels As long as TOMO stays above these support zone, we could start seeing a move towards $2.84, $3.14, $4.02, $5.45 and $6.88. Failure to hold the support at $2.13 could lead to a drop towards $1.70 and $1.47 so your stop loss should be just below $2.13 for your long position.
TOMO is currently trading at $2.72 with a market cap of $220,930,287. Its 24 hour trading volume was $31,259,134.


Large resistance point at $2.30 + Elliot wave should be cautiousWe're currently at the 1.6 extension compared to the last high and low. With such a large point of resistance here will we see a 5 wave elliot pattern? If so we'd retrace to the $1.4-1.6 range.The ideal alternative is we break the $2.30 resistance level and head towards $3.5 with a parabolic move. This will rely heavily on how Bitcoin behaves and if it sets a new high or if it heads lower in the process of it's current drop.
