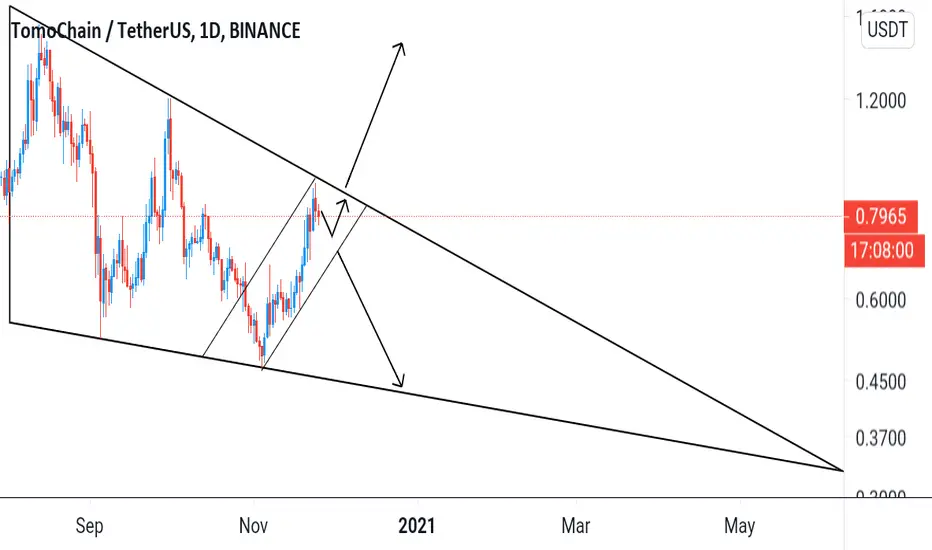
TOMOUSDT - Possible price actions TOMOUSDT bounced off the falling wedge support as expected from my previous analysis.
Price is testing the wedge resistance.
We could see a breakout above the falling wedge resistance ⬆️ or a rejection of the resistance level ⬇️.
TOMOUSDT trade ideas

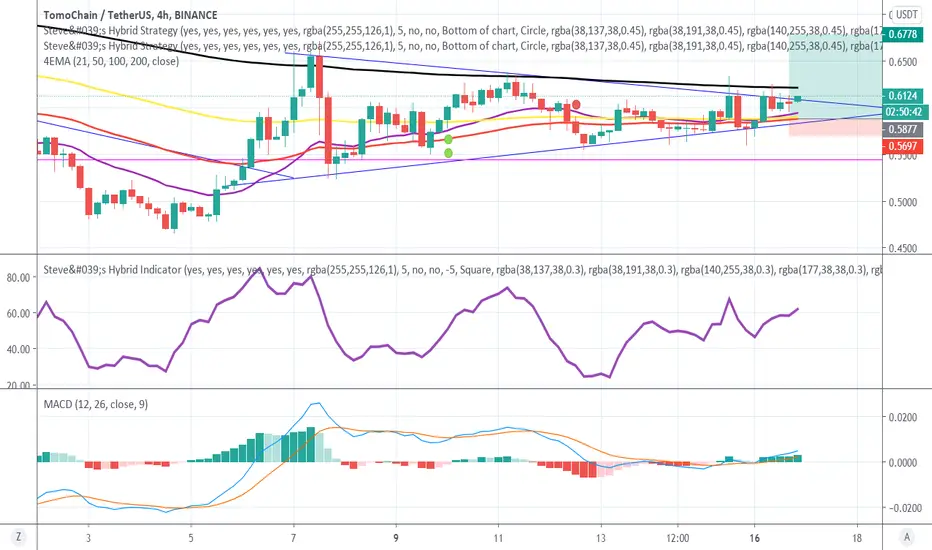
TOMOUSDTMy visualization of the tomo coin
Entry after the day's candle closes above the orange level
Goals are green
The endowment will close the day below the red level
Recall to maintain the capital management
Good luck.

TOMO TOMOChain Trendline Breakout - TOMOBTC TOMOUSD TOMOUSDTTOMO TOMOChain Trendline Breakout - TOMOBTC TOMOUSD TOMOUSDT

FOR SPOTTING POTENTIAL BREAKOUTS..EXAMPLES GIVEN IN MY TWEETCan look for the examples here twitter.com

TOMOUSDT Hammer SignalHello, dear subscribers!
Our Automatic Intraday Hammer Strategy revealed the potential trend reverse in TOMOUSDT price movement from the downtrend to uptrend.
Technical analysis confirmed this assumption. We can notice that the price is in the upward trend channel. Now price is on the support level, there is a high probability of the bounce off it. The Accumulation/Distribution Indicator demonstrates the weak bullish divergence: the price was in the downtrend, while the A/D value was almost at the same level. The final point of this analysis is that Stoch RSI indicates the oversold TOMO zone.
We expect the 4.5% price growth from 0.7318 to 0.7647. The alert was automatically executed by SkyRock Signals trading bot.

TOMOUSDT Hammer SignalHello, dear subscribers!
Our Autmatic Intraday Hammer Strategy revealed the potential trend reverse in TOMOUSDT price movement from the downtrend to uptrend.
Technical analysis confirmed this assumption. We can notice that the price is in the upward trend channel. Now price is on the support level, there is a high probability of rebounce. The Accumulation/Distribution Indicator demonstrates the weak bullish divergence: the price was in the downtrend, while the A/D value was almost at the same level. The final point of this analysis is that Stoch RSI indicates the oversold TOMO zone.
We expect the 4.5% price growth from 0.7318 to 0.7647. The alert was automatically executed by SkyRock Signals trading bot.


TOMOUSDTPERP - LONG - POTENTIAL 10.39%*NEW TRADE SET-UP*
TOMOUSDTPERP - LONG - POTENTIAL 10.39%
Leverage Optional: N/A
Entry- 6892
TP1 (75%) - 7230
TP2- (25%) - 7608
SL- 6364
- WARNING - Higher risk trading conditions - short-term bearish BTC signs that could draw market down
- RR - 1.36
- Trailing Buy - 0.5%
- Trailing Profit - 1%
- Trailing Stop-Loss - No


TOMO - USDTBuy Zone 0.5 - 0.6 ( level 0.52 - 0.56 - 0.6 )
TP : 0.7 - 0.8 - 0.9 --- 1 ++++
SL : under 0.45
DWYOR


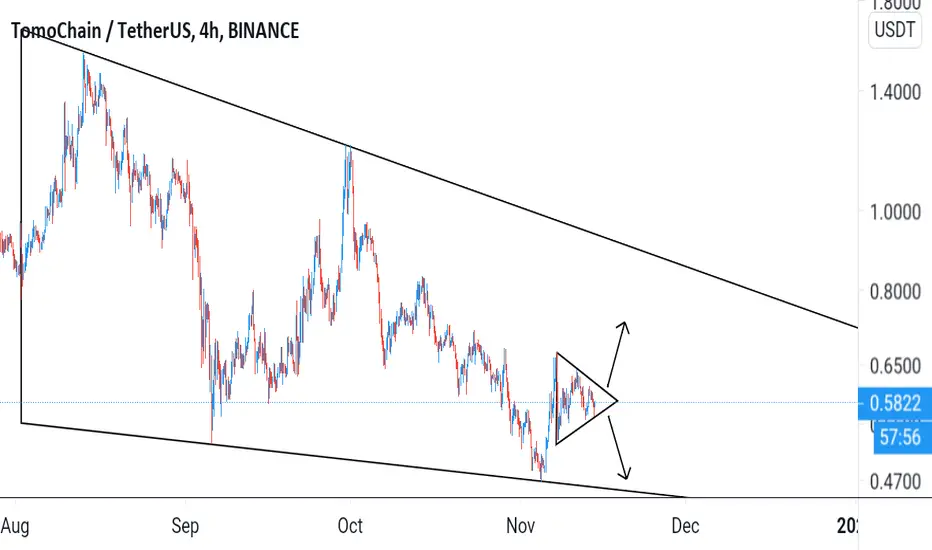
TOMOUSDT - Potential breakout TOMOUSDT is consolidating in a pennant chart pattern at the major falling wedge support.
Breakout is imminent.
Possible price actions indicated.
TOMO/USDT
Break through the yellow line
Login.....
Crossing the yellow line becomes the stop loss for the deal for those who want to continue with it
Good luck ,,,

Tomo breakout this resistence & go big.....Tomo has been a certain range for the last few weeks.If he can break the next resistence,hopfully he will get a big upward movement.

TOMO/USDT
Break through the yellow line
Login.....
Crossing the yellow line becomes the stop loss for the deal for those who want to continue with it
Good luck ,,,

THE PRICE STRUCTURE IS A DOWNTREND CHANNELthe price is in a downtrend channel in the 4h timeframe, wait for in the lower part of the channel to keep place the buy order.

TOMO/USDT - Long - Potential 13.72%***NEW TRADE SET-UP***
TOMO/USDT - Long - Potential 13.72%
Trade Set-Up Only:
N/A
Entry- 5756
TP1- 6057
TP2 - 6548
SL- 5395
Triggers;
- Secondary Break Up
- Trendline breakout and retest
- Rejection from local support
- Bounce off trend support
Notes;
- BTC stabilising and Volume consistent in ALT market
- Trailing Buy, TP & SL recommended

TOMO/USDTIm showing you what im seeing, not predicting the direction of the market. im looking for the next TOMO SEASON the bottom could be in based on what i see on the indicators and probably we are in the start of the accumulation moment. I draw 2 vertical lines one on the 13 of NOV and DIC becouse this coin accomplish month cycles (im based on the last run after each 13 the coin have change movement). Other thing to consider is that this coin have slowdown and long down trends thats the TOMO way but that was based on a BEAR MARKET CYCLE we are not on a bear market anymore. Other consideration is that i think than BTC is going down (Could be a fact that when BTC go down all the market do in most of the cases be carefull based on btc, other wise if TOMO outperform the majors downtrend it could be a rigth moment to be here.
Fundamental im bullish in long term becouse of TOMO P, LuaSwap for me is an idea at this moment but the team and Loung are hard workers, the adquisition on LIT was a good movement becouse insted of be a sidechain i think this guys want to enter in the Layer 2 race VS xDai, Matic, etc.
