TOMO: The Market BalanceIn the volatile world of cryptocurrency, TOMO stands out as a coin worth watching. Our analysis of the coin's performance on the 1-hour timeframe paints an intriguing picture.
The Fibonacci retracement tool, a common technical analysis tool used by traders, identifies several key levels to watch out for. The zero level stands at 1.6581, while the half and first levels are at 1.5309 and 1.4038 respectively. Further scrutiny reveals intermediary levels at 1.5981 (0.236 level).
A critical tool used to identify potential trend reversals, the 50-period Exponential Moving Average (EMA), currently sits at 1.5368. Traders keeping an eye on this figure may gain insight into the market's overall sentiment towards TOMO.
The volume oscillator, a measure of volume change, displays a -13% reading. This could suggest a decrease in trading activity that could potentially impact the strength of the current trend.
The Stochastic oscillator and the Relative Strength Index (RSI) – two indicators used to identify overbought or oversold conditions – stand at 65 and 63 respectively. These values point towards a neutral market, neither significantly overbought nor oversold.
The On-Balance Volume (OBV), an indicator that uses volume flow to predict changes in price, is currently at 144 million. This metric, coupled with the modest 9% change in price over the past 24 hours (leaving TOMO at a current price of 1.6314), paints a picture of an active market.
The Bollinger Bands, a statistical chart characterizing the prices and volatility of TOMO, show the upper band at 1.6843, the middle at 1.5911, and the lower at 1.4978. This information could be pivotal for traders in identifying short-term price volatility.
Most notably, the market performance over the past week suggests that TOMO is near a critical resistance level. On Monday, June 12th, the price peaked around 1.7, and just a few days earlier, on Thursday, June 8th, another high was registered at around 1.6467.
In conclusion, the current indicators and recent performance suggest TOMO is heading for a critical test at its resistance level. As always, trading decisions should be made based on a comprehensive analysis of market conditions and personal risk tolerance.
TOMOUSDT trade ideas

TOMO going UPThe instrument is in the ascending channel, as well as currently in the growth leaders. The resistance level is formed on the chart. Extremes on volumes, which statistically indicates the presence of a participant. At the moment, a preload to the level is being formed. I recommend going in with activity in a glass.

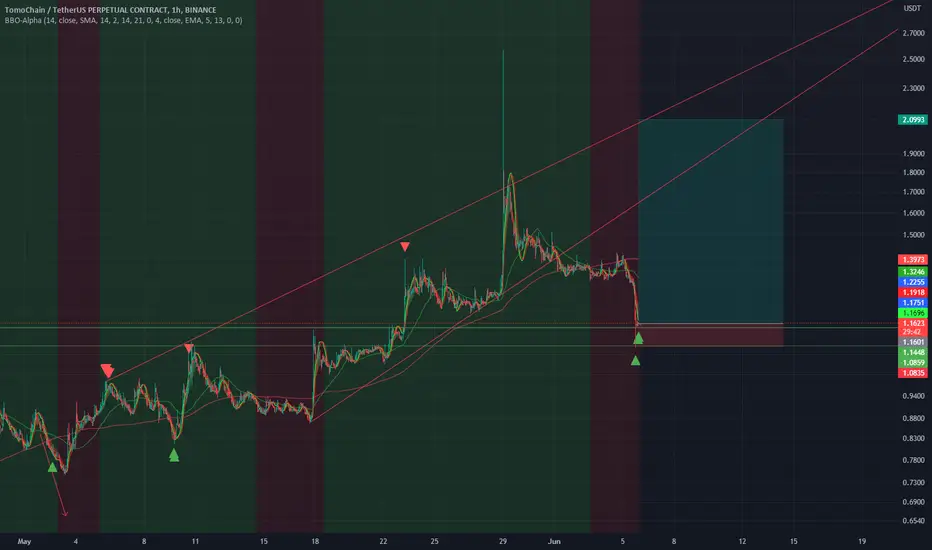
I think TOMO can give us all a great short positionBy reaching the supply range of this currency and considering the weakening of the upward trend, we can use these two resistance levels for our own short trades.


TOMOUSDT(TomoChain) Daily tf Range Updated till 12-06-23TOMOUSDT(TomoChain) Daily timeframe range. volume is weak here so gotta be careful from the wicks. beside that from start of 2023 it only gone up. i am not shilling it, you can see that in the chart.


TOMOUSDT is testing supportHello everyone. Today we will consider a coin that differs significantly from others in its graph-this is TOMOUSDT. The price has been holding a strong trend for 4 months. But the coin also has strong volatility, so the price can go in fairly large percentage ranges. For 3 months, the coin has been in the ascending channel and now the price is clearly fixed above the upper line of the channel. I expect a further rebound in the price with a target of 1.66

TOMO moving downTOMO reached the supply zone in daily timeframe and now is moving downward to break the trend line; a bearish market, which is probable, can give a giant profit on short position

Tomo short testingI am testing a modified script for trading on short and long-term segments, do not open positions without your own TA, stoploss is only indicative


TOMO has strong recistance levelAfter a strong growth, the instrument was kept in the range, forming a long accumulation, the extremes of the range on volumes, which statistically indicates the presence of a participant. the level is on a round number . I recommend waiting for a local preload to confirm the breakdown scenario.

TOMO long testing AlphaHello, after some time of testing I am returning to the original script for the Alpha indicator, it does have some flaws but it is ideal for trading within a 1h time chart, I am also testing another one for a shorter interval such as 15 min but the win rate there is so-so. Let's test if TOMO retests where it left off from (ascending triangle).
TOMO looking bullish (Long Setup)I expect a minor pullback to the highlighted area and at least a 15% growth from there!
NFA

TOMO's Mixed Market SignalsIn this analytical article, we're turning our attention towards TOMO with a time frame set to 4 hours. Currently, the price of TOMO is recorded at $1.4133, which is a solid uptick of 14% in the last 24 hours.
In terms of potential resistance and support, we can use Fibonacci retracement levels as significant markers. The initial Fibonacci level is pegged at $2.548, with the zero level down at $1.0825. Midway between these two, we have the half-level Fibonacci at $1.8153. Furthermore, additional resistance could be found at the upper Bollinger Band currently positioned at $1.4648.
The Bollinger Bands, which provide insight into price volatility and potential overbought or oversold conditions, show the middle band at $1.3220 and the lower band at $1.1793. These levels might serve as crucial support if a price pullback occurs.
The Relative Strength Index (RSI) is presently at 59, representing a fairly neutral market condition. However, the stochastic oscillator reading of 80 suggests that the market is veering into overbought territory, which could precede a potential price correction.
The volume oscillator value of 25% signals an increase in trading volume, which can amplify the strength of the current trend. However, a note of caution is warranted due to the MACD (Moving Average Convergence Divergence) being in negative territory at -0.0071, a possible bearish signal.
In summary, TOMO's current market condition displays a mix of bullish momentum tempered by potentially overbought conditions. Key resistance levels lie at the upper Fibonacci level and Bollinger Band, while significant support could be found at the lower Fibonacci and Bollinger levels. As always, crypto traders are advised to use a combination of indicators, global market conditions, and their personal risk tolerance to navigate their investment decisions.

TOMO ---> Simple analysishello guys...
tomo made a cover-up candle and before that formed a compression so I believe the moves that I've drawn it!
what do you think?!
---------------------------------
always do your research.
If you have any questions, you can write them in the comments below, and I will answer them.
And please don't forget to support this idea with your likes and comment

TOMO 1hThe 1-hour accumulation on TOMO has been confirmed, and I am patiently waiting for the opportune moment to participate in the breakout from 1.3956. While TOMO may continue to accumulate for some time, the support zone is now clearly defined.
The accumulation phase presents a good opportunity to make some purchases and wait. However, I personally prefer to align my moves with market volumes and breakout patterns. One strategy could be to buy in increments, such as 5%, 10%, or 15%, and add additional percentages once a breakout has already occurred.

Repetitive pattern on TOMOTOMO chain repeating this bearish pattern in a 5-7 day cycle; be ready to open long once the breakout happened

Repetitive pattern on TOMOTOMO chain repeating this bearish pattern in a 5-7 day cycle; be ready to open long once the breakout happened

Tomochain forming Falling Wedge In Weekly Timeframe
Incase Of breakout Expecting 500 To 600% Bulish Move In midterm
Wait Patiently For breakout To be Confirmed

TOMOUSDT wants the breakout? TOMOUSDT has bounced off the daily demand zone at the $0.33 level, indicating that there is significant buying pressure at this level. This could be a bullish signal that the price may be about to rise.
Currently, the price of TOMOUSDT is testing the 4-hour resistance level. If the price is able to break through this resistance level, it could be a sign that the bulls are in control and that the price may continue to rise in the short term.
However, before making any trading decisions, it is important to consider Plancton's rules, which are a set of guidelines for trading based on market analysis. According to these rules, a new long position should only be taken if the price does indeed break through the 4-hour resistance level. This would confirm that the bulls are in control and that there is a higher likelihood of a further price increase.
–––––
Follow the Shrimp 🦐
Keep in mind.
🟣 Purple structure -> Monthly structure.
🔴 Red structure -> Weekly structure.
🔵 Blue structure -> Daily structure.
🟡 Yellow structure -> 4h structure.
⚫️ Black structure -> <= 1h structure.
Follow the Shrimp 🦐

TOMO : THE IMPORTANT BREAKOUT LINETomo shows depending on this trend study that it's on an important line where its the ability to break out and able to show important price action.

tomousdt long position lets see Tomo longed it can bounce fro mentioned support and soon it will moon lets see
