US2000 trade ideas

US2000 Short bear flagFinally seeing enough to get short here. Been a choppy couple of weeks with a false-rally on most indexes, which are now all looking likely to test lows again. This Bear Flag is complete with three highs and has started to breakdown. Target is the low around 1.6R.

Long RUT targeting ATHI think I over targeted on the last RUT short posted. We've held the 161 of the topping swing. I'll be really bearish if we can break that level but in my experience when we have this topping formation and it fails to break the 161 a parabolic rally is coming next.
And the next short is much more interesting.

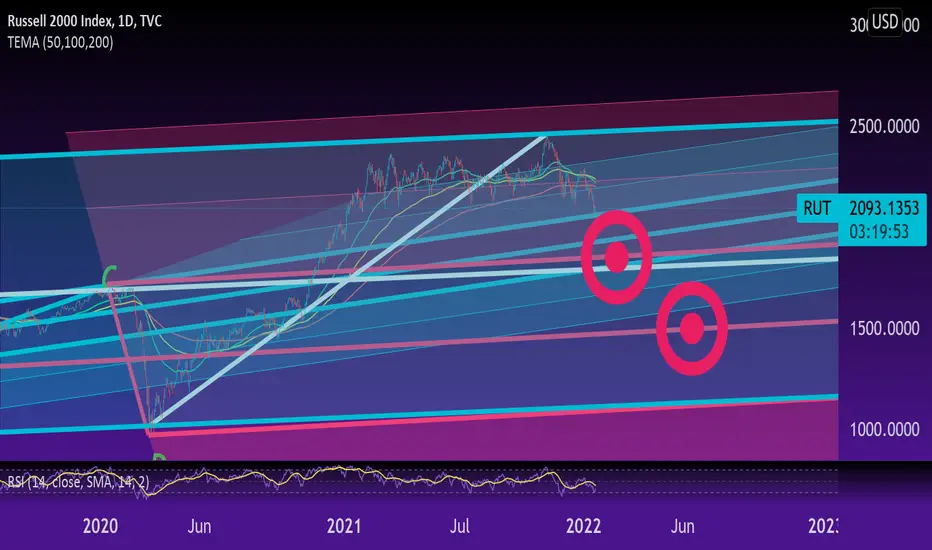
Are Small Caps Taking Leadership Again?The Russell 2000 led markets to the downside in recent months . Now it may be leading the rebound.
Notice how RUT made new February highs yesterday and today, while the S&P 500 and Nasdaq-100 are below their highs last week.
Next, consider the price zone around 2,000. This is not only a “nice round number.” It’s also a level RUT broke on high volume early last year. (You can use IWM’s chart for the volume.)
Third, RUT is back above both its 8- and 21-day exponential moving averages.
Fourth, consider this long-term chart showing the ratio between small caps and the Nasdaq-100. It shows RUT near its lowest relative valuation since the tech bubble started deflating in mid-2000:
TradeStation is a pioneer in the trading industry, providing access to stocks, options, futures and cryptocurrencies. See our Overview for more.
Important Information
TradingView is not affiliated with TradeStation Securities Inc. or its affiliates. TradeStation Securities, Inc., TradeStation Crypto, Inc., and TradeStation Technologies, Inc. are each wholly owned subsidiaries of TradeStation Group, Inc., all operating, and providing products and services, under the TradeStation brand and trademark. When applying for, or purchasing, accounts, subscriptions, products and services, it is important that you know which company you will be dealing with. Please click here for further important information explaining what this means.
This content is for informational and educational purposes only. This is not a recommendation regarding any investment or investment strategy. Any opinions expressed herein are those of the author and do not represent the views or opinions of TradeStation or any of its affiliates.
Investing involves risks. Past performance, whether actual or indicated by historical tests of strategies, is no guarantee of future performance or success. There is a possibility that you may sustain a loss equal to or greater than your entire investment regardless of which asset class you trade (equities, options, futures, or digital assets); therefore, you should not invest or risk money that you cannot afford to lose. Before trading any asset class, first read the relevant risk disclosure statements on the Important Documents page, found here: www.tradestation.com .

In which phase do you think small caps are?What would be the point of publishing something without making the audience think about it?
Questions:
1- Do you think there is a similarity between this chart and the picture below it?
2-If you think there is a similarity, which phase do you think small-caps are in?
3- do you want to learn more about this type of analysis?
if your answer is yes, you can read the free articles:
www.investopedia.com
www.investopedia.com
www.investopedia.com
Best,
Moshkelgosha
DISCLAIMER
I’m not a certified financial planner/advisor, a certified financial analyst, an economist, a CPA, an accountant, or a lawyer. I’m not a finance professional through formal education. The contents on this site are for informational purposes only and do not constitute financial, accounting, or legal advice. I can’t promise that the information shared on my posts is appropriate for you or anyone else. By using this site, you agree to hold me harmless from any ramifications, financial or otherwise, that occur to you as a result of acting on information found on this site.

Small Caps / S&P 500It looks like small caps will severely under-perform the S&P500 with the current trend,

Small Caps - still BearishSmall caps have not broken out yet! Be careful as this could be a bull trap!

What to expectThe same pattern from 2000/2008 is playing out, only faster this time.
Is the situation different? Sure.
Is the overall environment fundamentally different? No.
I don't think it's unreasonable to expect the same result.

$RUT Russell 2000 Could be making a new channelTVC:RUT
Follow and like for more updates..
#AHMEDMESBAH

Short squeeze to retest ATH.One last move up for some good ol' MM manipulation so that institutions have more time for distribution and to line certain timelines up regarding the vaccine agenda. Overall I'm a bear but VIX is fixing for 13 end of Feb after todays lower low.

Bear Market is official for Small Caps ..!What Is a Bear Market?
A bear market is when a market experiences prolonged price declines. It typically describes a condition in which securities prices fall 20% or more from recent highs amid widespread pessimism and negative investor sentiment.(Investopedia)
21% decline in the past 12 weeks makes Bear Market in Small-cap official..!
I think there is no need to say it was in my 2022 Forecast published on January 4th, 2022!
Conclusion:
1-The Energy and Banks sector could continue their rally in January 2022..!
2-Tech stocks especially those which still burn cash, will experience a hard time in 2022, and any positive must be considered as transitory!
3-Small caps may experience lower prices and even Negative returns in 2022.
4-SPX, NDX, and DJI could have 10-15% returns in 2022.
5-Keep in mind that 12 monthly rates of change decreased by half in the past 10 months for SPX , NDX, and DJI which means expected market ROI should be lower in 2022 in comparison to 2021 and 2020!
6-For small caps this phenomenon is even worse, they lost 85% of their gains, and continuation of this phenomenon could lead to a negative return in 2022. ( Fundamentals also support depreciation of unprofitable business in high inflation era)
7- 2022 will be the year for those who know how to handle high volatility! A year for aggressive portfolio management strategies!
I will provide updates for this analysis as needed.
Best,
Moshkelgosha
DISCLAIMER
I’m not a certified financial planner/advisor, a certified financial analyst, an economist, a CPA , an accountant, or a lawyer. I’m not a finance professional through formal education. The contents on this site are for informational purposes only and do not constitute financial, accounting, or legal advice. I can’t promise that the information shared on my posts is appropriate for you or anyone else. By using this site, you agree to hold me harmless from any ramifications, financial or otherwise, that occur to you as a result of acting on information found on this site.

US2000 Control Area...After having analyzed the behavior in today's relevant news, we see that there has been an institutional accumulation and there is a bullish projection.
Best Regards.
@MartinTopTrader

US2000 Waiting for...In trading you do not operate constantly, you have to listen to the market and wait for it to give us clear information to operate while limiting the risk well.
Best Regards.
@MartinTopTrader

russell index in silver terms? crazy? silver 50+? next decade?if inflation and interest rates due to debt persist, why wont gold and silver see a bid up?
If gdp and company growth rates slow down, isnt the multiple on stocks a bit enthusiastic?
dow to gold, sp500 to gold, and most traditional measures are on the high side. Why wouldnt I consider the old money, silver for a hold for the next decade?
$silver #silver $gold $gold $platinum #platinum

RUT TargetsAction reaction chart
For those who have watched the recent video i have added an Andrews Fork off the recent high
To derive these targets
GRI 2022
Russell 2000 Geometry: 1500 mid term targetWe run through the Russell geometry which is interesting
Starts off similar to the Dow but ends with what I think is a huge distribution top
Let's see what happens
GRI 2022
NOT TRADING ADVICE

Confirmed Rectangle TopToday We can say a Rectangular Top pattern has been confirmed and small-cap will experience another 10-15% decline!
This is the lowest level since Jan 29th, 2021.
This could happen very fast in the next 2-6 weeks!
TZA (Small-cap 3x inverse ETF) volume doubled in volume in the past 3 months, and could go up to 37-42 levels!
You can see the most important support(green line) and resistance (red line) levels.
Best,
Moshkelgosha
DISCLAIMER
I’m not a certified financial planner/advisor, a certified financial analyst, an economist, a CPA, an accountant, or a lawyer. I’m not a finance professional through formal education. The contents on this site are for informational purposes only and do not constitute financial, accounting, or legal advice. I can’t promise that the information shared on my posts is appropriate for you or anyone else. By using this site, you agree to hold me harmless from any ramifications, financial or otherwise, that occur to you as a result of acting on information found on this site.

Most important level for Small caps..!The Russell 2000 Index is a small-cap stock market index that makes up the smallest 2,000 stocks in the Russell 3000 Index. It was started by the Frank Russell Company in 1984. The index is maintained by FTSE Russell, a subsidiary of the London Stock Exchange Group.
As you can see in this chart Small caps had a sinewave pattern in the past trading year, anytime they entered this level they bounce back:
A:
RUT close below 2080 this pattern could make a rectangular Top..!
B:
otherwise, we see another upward move between 10-15% in small caps!
You can see the most important support(green line) and resistance (red line) levels.
Best,
Moshkelgosha
DISCLAIMER
I’m not a certified financial planner/advisor, a certified financial analyst, an economist, a CPA, an accountant, or a lawyer. I’m not a finance professional through formal education. The contents on this site are for informational purposes only and do not constitute financial, accounting, or legal advice. I can’t promise that the information shared on my posts is appropriate for you or anyone else. By using this site, you agree to hold me harmless from any ramifications, financial or otherwise, that occur to you as a result of acting on information found on this site.

One more week of this [bs...]?In tandem with crypto, RUT may be over its mega sideways move shortly. Estimating another week, same as BTC . These guys...

TIIIIIMMMBBBBBEEEEERRRRRRussell 2000:
• No buyers higher
• Testing support for the thousandth time in a year
• Rate hikes
• Inflation
• All bad
• Fibonacci show oversold in lieu of reversal
○ My Thought:
TIMMMBBBBERRRRR!!!!!!!! Small caps looks so weak up here it is not even funny we are testing this support for the umpteenth time since last year. Its time we go lower. This is where rate hikes could impact the earliest. A lot of bag holders up here hoping rate hikes and corrections come in. honestly why people bought so high when they there is literally no volume lower.. I would short the mess out of this
This can go 1 of two ways we can bounce again for the thousandth and one time which I highly doubt or we are coming down to 1761, and then 14 ETF: IWM: Overall: BEARISH
Today: BEARISH

RUT looking for a reject price level$RUT H&S pattern confirmation, price action is wild. RUT has formed multiple gaps towards the upside. However I don’t think it’ll have the momentum to continue. It does look like RUT is aiming for 2222.20 price level. Depending on how it will close, We may see a test and reject down the to 2145 level.
Important price level to pay attention to:
4HR candles closing below 2210.68, I’d BTO puts for $2145 weeklies;
4HR candles closing above 2289, we may have a run up to 2394.23

Russell 2000 Bull Run?If up for Wave 1 back for Wave 2 then we have an opportunity for strong massive Wave 3 up.
If the invalidation hit which is still valid as we need to confirm but if hit then I would expect it to reach 1920 area.
GOODLUCK!

Possible Recangular Top in Small cap's Index..!1- Closing below the 50EMA after 78 weeks
2- Sideway for the past 45 weeks
Possible scenario:
A: Rebound at 2080-2100 level
or
B: closing below 2080 level and further decline to 1780-1700 and completing a rectangular top formation
Best strategy: wait for A or B, it is not a good time to Short/Long
This time could be different:
and we may see a breakout
Education:
A rectangle occurs when the price is moving between horizontal support and resistance levels. The pattern indicates there is no trend, as the price moves up and down between support and resistance. The rectangle ends when there is a breakout, and the price moves out of the rectangle. (Investopedia)
You can see the most important support(green line) and resistance (red line) levels.
Best,
Moshkelgosha
DISCLAIMER
I’m not a certified financial planner/advisor, a certified financial analyst, an economist, a CPA, an accountant, or a lawyer. I’m not a finance professional through formal education. The contents on this site are for informational purposes only and do not constitute financial, accounting, or legal advice. I can’t promise that the information shared on my posts is appropriate for you or anyone else. By using this site, you agree to hold me harmless from any ramifications, financial or otherwise, that occur to you as a result of acting on information found on this site.
Reference:
www.investopedia.com
