US30 - LONGWaiting for the retest all day and finally got it in after hours trading. Looking for price to continue to the upside now that we got the retest.
US30 trade ideas

"US30/DJI" Index Market Bullish Robbery (Swing Trade Plan)🌟Hi! Hola! Ola! Bonjour! Hallo! Marhaba!🌟
Dear Money Makers & Robbers, 🤑 💰💸✈️
Based on 🔥Thief Trading style technical and fundamental analysis🔥, here is our master plan to heist the "US30/DJI" Index Market Heist. Please adhere to the strategy I've outlined in the chart, which emphasizes long entry. Our aim is to escape near the high-risk YELLOW MA Zone. It's a Risky level, overbought market, consolidation, trend reversal, trap at the level where traders and bearish robbers are stronger. 🏆💸"Take profit and treat yourself, traders. You deserve it!💪🏆🎉
Entry 📈 : "The vault is wide open! Swipe the Bullish loot at any price - the heist is on!
however I advise to Place buy limit orders within a 15 or 30 minute timeframe most recent or swing, low or high level. I Highly recommended you to put alert in your chart.
Stop Loss 🛑:
Thief SL placed at the Nearest / Swing low level Using the 3H timeframe (39200) Day/Swing trade basis.
SL is based on your risk of the trade, lot size and how many multiple orders you have to take.
🏴☠️Target 🎯: 42400
💰💵💸"US30/DJI" Index Money Heist Plan is currently experiencing a bullishness,., driven by several key factors. .☝☝☝
📰🗞️Get & Read the Fundamental, Macro Economics, COT Report, Geopolitical and News Analysis, Sentimental Outlook, Intermarket Analysis, Index-Specific Analysis, Future trend targets with Overall outlook score... go ahead to check 👉👉👉🔗🔗🌎🌏🗺
⚠️Trading Alert : News Releases and Position Management 📰🗞️🚫🚏
As a reminder, news releases can have a significant impact on market prices and volatility. To minimize potential losses and protect your running positions,
we recommend the following:
Avoid taking new trades during news releases
Use trailing stop-loss orders to protect your running positions and lock in profits
💖Supporting our robbery plan 💥Hit the Boost Button💥 will enable us to effortlessly make and steal money 💰💵. Boost the strength of our robbery team. Every day in this market make money with ease by using the Thief Trading Style.🏆💪🤝❤️🎉🚀
I'll see you soon with another heist plan, so stay tuned 🤑🐱👤🤗🤩

Us30 longLong position from 41200. I think the 41400 region gets hit pretty soon.
If not tonight , tomorrow when stocks open i think she will start jumping higher.

DowJones INTRADAY NFP volatility trigger! Momentum is bullish, but today’s NFP report is a key risk event. A weaker-than-expected jobs number could reinforce rate cut bets and extend the rally. A surprise beat may trigger profit-taking.
Key Support and Resistance Levels
Resistance Level 1: 41200
Resistance Level 2: 42000
Resistance Level 3: 42710
Support Level 1: 39446
Support Level 2: 38490
Support Level 3: 37840
This communication is for informational purposes only and should not be viewed as any form of recommendation as to a particular course of action or as investment advice. It is not intended as an offer or solicitation for the purchase or sale of any financial instrument or as an official confirmation of any transaction. Opinions, estimates and assumptions expressed herein are made as of the date of this communication and are subject to change without notice. This communication has been prepared based upon information, including market prices, data and other information, believed to be reliable; however, Trade Nation does not warrant its completeness or accuracy. All market prices and market data contained in or attached to this communication are indicative and subject to change without notice.

US30 - AnalysisKey Levels to look for:
Resistance - 41250
Support - 40800
Currently price show a neutral trend. Resistance level must be broken for a bullish outlook as long as support is respected. A double top formation near resistance level. Failure to break this level will result in retest of support level.

US30 Buy NFPHere is my NFP signal, buy US30. There is a clear bullish flag. Buy gold, buy gbpusd. We are flushing the usd today

DJI: This looks huge!The Dow Jones has broken above its 125 year trend line and right now it looks like it may have a successful re-test, which could be huge.

long ideaThis Analysis Can Change At Anytime Without Notice And It Is Only For educational Purpose to Traders To Make Independent Investments Decisions.
Disclaimer
The information and publications are not meant to be, and do not constitute, financial, investment, trading, or other types of advice or recommendations supplied or endorsed by TradingView

US30: Time to Reverse or Push Higher?Hey Traders,
As you can see on the chart, price tapped into a major level around the $37,000 area, where we saw a weekly liquidity grab followed by a 4H change of character — leading to a strong push up to the $40,800 zone.
Now, we’re looking at two possible scenarios:
📌 Scenario 1:
Price pulls back to the $39,100 area and gives a solid 4H confirmation → Targeting the $41,000 zone.
📌 Scenario 2:
Price breaks below the $39,100 area and the trendline, then pulls back into the same level with confirmation → Targeting the $37,000 / $36,000 area.
⚠️ This is not financial advice — just sharing my view on the current setup.
Be safe, be happy, and have a great trading day.
– Mr. Wolf 🐺

Weekly Forex Outlook Sun.May.4.2025 - Fri.May.9.2025Like and Comments would be appreciated :D Not Financial Advice, Just my outlook/opinion

US30 Breakout Confirmed – May 1, 2025 🔥 US30 Breakout Confirmed – May 1, 2025 🔥
📈 We Finally Cleared the Range!
US30 just exploded past the 40,360-40,700 resistance, tagging 40,870 with strength. This is the clean breakout bulls were waiting for — structure broke, EMAs supporting, and momentum’s on the side of the buyers 💪📊
🔍 Technical Breakdown:
✅ Clean breakout above 40,700
📈 Higher highs + higher lows confirmed since 4/19
🧠 Break + retest of 39,775 support zone last week
📊 EMAs (blue & white) strongly sloped upward = trend confirmation
🎯 Trade Ideas:
Breakout Pullback Entry:
🔁 Wait for a retest of 40,700 – 40,750
🎯 Targets: 41,200 → 42,000 → 42,359
Aggressive Longs:
Enter now with tight risk under 40,700
📍 Target next resistance at 42,359 or even 42,787 in the coming sessions
Bearish Invalidated Until:
🔻 39,775 breaks — no shorts while above EMAs + structure

YFI/USDTIn this analysis, I’m tracking the recent downtrend on the US30 daily chart. Based on the current pattern and technical indicators (like RSI divergence and a bounce off a key support zone), I expect a potential reversal or at least a short-term correction. Entry signal is marked based on my Smart Bot strategy.

Dow Jons artistic outlook - a proposition for you to take or disWhen I'm looking at my chart, i like to know what this story is about.
This is what
the whole world is looking at,
some say between 1-5 years from, now we are all going to see what it is about.
Most of us want to prosper but there is a certain minority group who doesn't want that. Why? IDK tell me that.
--------------------------------------------------
The chart do not represent a prediction of any kind its more an invitation how to start thinking -about build.
---------------------------------------------------
Time is short although my chart is on 12 month time line
=================================================
they say 1-5 years but very unlikely now. I don't know if you can see that
there is a time in next 3 years when the trend goes up.
Its my 10 years of experience i and some hard challenging times. i tracked dow nearly 24/7 for 3 years now so i know what it is about. to explain it to you in full could take some time and here is not a place to do just that.
You can see some general shapes and possible traversals, it happens i track them quite correctly due to my different mind.
"I have good intuition when I'm true to myself
this is my point of view I hope to share with you."
SimonTheBeekeeper
PS:
when things starts to move fast
i have my map to find out
where and how.
--------------
thanks for watching I

US30 Stuck at Resistance – 05/05/2025🛑 US30 Stuck at Resistance – 05/05/2025 🛑
📈 Strong Bounce – But Watch This Supply Zone!
US30 ripped from the 36,700s all the way back above 41,000 🔥 — but now we’re seeing price stall just under a major resistance zone at 41,200–41,300. Bulls have full control for now, but signs of exhaustion are building 🥵.
🔍 Key Observations:
🔹 Price holding above 40,700 (key support)
🔹 41,200–41,300 = local resistance zone
🔹 42,359 = next major upside target 🎯
🔹 EMAs still bullish but starting to curve → 🌀 possible slowdown?
⚠️ Expect a squeeze or rejection play soon — market is winding up for the next breakout or pullback 💣.
🎯 Trade Plan:
🟰 Current range = 40,700 – 41,300
🔻 Lose 40,700 = retrace likely to 39,775, possibly 39,200
🚀 Break + close above 41,300 = upside open toward 42,359–42,787
🧠 Mindset Reminder:
🔁 Don’t chase highs! Wait for clean structure or rejection
⚡ When EMAs compress, expect volatility to explode
💎 Patience + plan = edge

possibity of uptrendIt is expected that a corrective and fluctuating trend will form in the current resistance range. Then the upward trend will likely continue.


US30 update chart analysis US30 update off Higher Time frames and using FVG,Liquidity Zones, Trend Lines I can see Us30 chasing sellside LQ it can retrace up to Daily Buyside LQ which is 800 pips from current price. the drop is looking like 3k pips close to 4k pips ish. Safe trading.

US30: Next Move Is Up! Long!
My dear friends,
Today we will analyse US30 together☺️
The market is at an inflection zone and price has now reached an area around 39,955.7 where previous reversals or breakouts have occurred.And a price reaction that we are seeing on multiple timeframes here could signal the next move up so we can enter on confirmation, and target the next key level of 40,208.3.Stop-loss is recommended beyond the inflection zone.
❤️Sending you lots of Love and Hugs❤️

My US30 Outlook For MondayFor now, my bias on US30 is bullish.
Based on the current price action and structure, I’m expecting continued buying pressure into the Supply Zones overhead.
I'll be following the bullish momentum carefully and will maintain a buy bias until further notice, while staying alert for any signs of weakness or reversal as we approach key resistance areas.
Just a reminder — I'm a regular guy who’s learning and improving every day in this trading journey. This is not financial advice — it’s simply my personal view based on my current analysis. Always do your own research and manage risk properly!

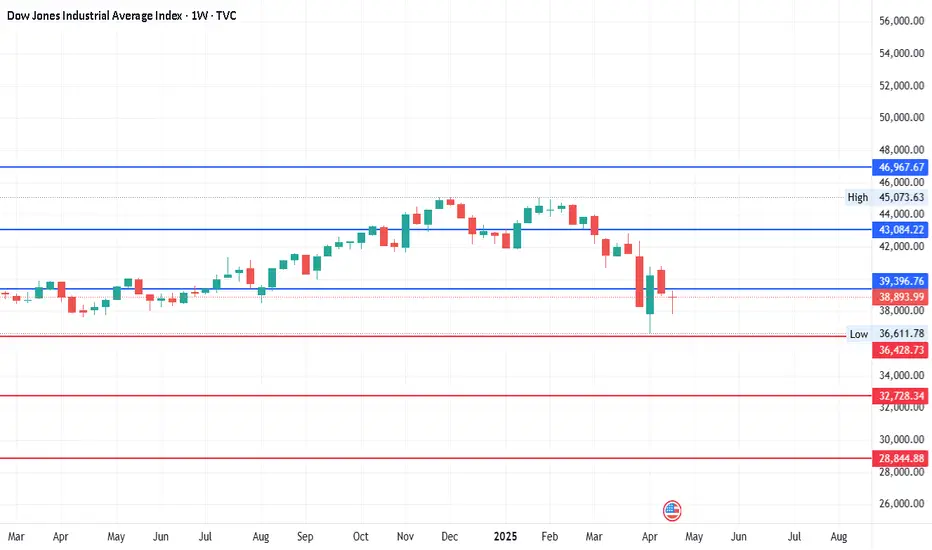
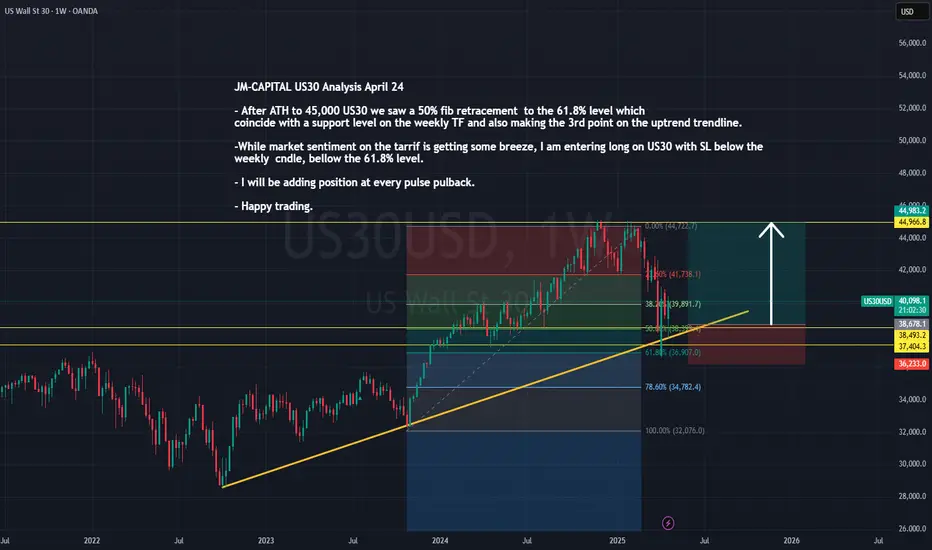
JM-CAPITAL US30 Analysis April 24After reaching an all-time high of 45,000, US30 experienced a pullback, retracing to the 61.8% Fibonacci level—aligning perfectly with a key support zone on the weekly timeframe and forming the third touchpoint on the ascending trendline.
With market sentiment beginning to ease around the tariff discussions, I’m taking a long position on US30. My stop loss is set just below the weekly candle and beneath the 61.8% Fibonacci level for added protection.
I plan to scale into the trade by adding positions on each corrective pullback in line with the bullish structure.
Wishing you all a profitable trading session. Stay sharp!
US30 | 1H | BUYHey There;
SIGNAL ALERT
BUY US30 / 38,689,19
🟢TP1: 39,258,56
🟢TP2: 39,910,75
🟢TP3: 41,287,59
🔴SL: 37,415,50
RR / 2,00
Please don't forget to like 🙏🏻
Thanks to everyone who supports my analysis with likes. 💙💙💙

Dow Jones - Volatility is HighLevels mentioned here are based on the market volatility and it is purely for the study purpose only.