US30 - BullishUS30 formed a double bottom and broke its neckline confirming bullish reversal. Now it is testing 0.5-0.618 Fib level of its last bullish leg.
US30 trade ideas

DOW 104% TARIFFS on China activated. Can the market be saved?Dow Jones (DJIA) is almost on its 1W MA200 (orange trend-line) and earlier today President Trump activated 104% duties on Chinese imports. This is far from being an encouraging development especially after Monday's attempt for the market to recover.
Most of the gains were lost yesterday and today it is a wait-and-see game in anticipation of the market reaction on the opening bell of Wall Street.
From a long-term technical perspective however, Dow is on a huge buy level that we've only seen another 4 times since the Housing Bubble bottom in March 2009. That buy level consists of two conditions: price touching the 1W MA200 and the 1W RSI hits (or comes extremely close to) the 30.00 oversold limit.
As you can see that has happened last time on September 19 2022 (Inflation Crisis bottom), March 09 2020 (COVID crash), August 24 2015 (China slowdown, Grexit) and August 08 2011 (first correction since 2009 Housing Crisis). The situation most similar to the current, is the COVID crash as it was the fastest drop to the 1W MA200 and 1W RSI to 30.00.
Despite the brutal correction, it took the market 'only' 43 weeks (301 days) to reach again the 0.786 Fibonacci retracement level. That is the top of the Blue Zone of the Fibonacci Channel Up that started on the March 2009 Housing bottom. The Blue Zone, consisting of the 0.786 - 0.382 Fib range, is important as it has dominated the multi-year bullish trend and contained the price action inside it, with only a few occasions diverging outside of it.
The longest it took Dow to reach the 0.786 Fib again after such correction was 110 weeks (770 days) and that interestingly enough happened two out of the four times. Practically reaching the 0.786 Fib constitutes a Cycle Top.
So essentially, despite the uncertainty and panic, the market is technically on a Support level that in 16 years we've only seen another 4 times, that's once every 4 years, which is a fair sample of a Cycle size. As a result, assuming stability comes to the world through trade deals (and why not Rate Cut announcements), we may see Dow reaching its 0.786 Fib again (and make new ATH) the fastest by February 02 2026, hitting 49000 and the longest by May 17 2027, hitting 56000 roughly.
-------------------------------------------------------------------------------
** Please LIKE 👍, FOLLOW ✅, SHARE 🙌 and COMMENT ✍ if you enjoy this idea! Also share your ideas and charts in the comments section below! This is best way to keep it relevant, support us, keep the content here free and allow the idea to reach as many people as possible. **
-------------------------------------------------------------------------------
💸💸💸💸💸💸
👇 👇 👇 👇 👇 👇

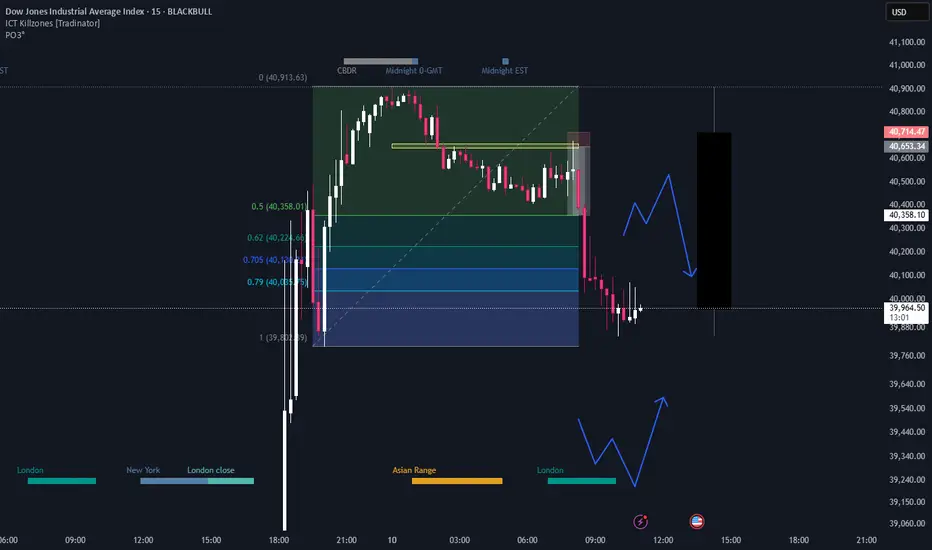
Hanzo | US30 15 min Breaks – Will Confirm the Next Move🆚 US30
The Path of Precision – Hanzo’s Market Strike
🔥 Key Levels & Breakout Strategy – 15M TF
🔥 Deep market insight – no random moves, only calculated execution.
☄️ Bearish Setup After Break Out – 38600 Zone
Price must break liquidity with high volume to confirm the move.
🩸 15M Time Frame Confluence
————
CHoCH & Liquidity Grab @ 39610
Key Level / Equal lows Formation - 37750
Strong Rejection from 39280 – The Ultimate Pivot
🔥 1H Time Frame Confirmation
Twin Wicks @ 37700 – Liquidity Engineered
Twin Wicks @ 38300 – Liquidity Engineered
☄️ 4H Historical Market Memory
——
💯 2024 – Bearish Retest 38000
💯 2024 – Bearish Retest 37600
👌 The Market Has Spoken – Are You Ready to Strike?

Bullish ideaUS30 may rise if it remains above 36,000 as it is a halfway mark of the previous bull run.
As long as price is above 36,400 and 37,000, the indice may try to reach 39,000 and 40,500.
Price action is oscillating between 42,500 and 36,400.

Long US30 !!After a long slip the pair manage to find its feet yesterday at 36... It has now pushed to break 38... Could this be a change of trend or just pull back for more bearish movement, I'm riding a bull

NFP NQ / US30 advise for u read description i took this trade today early now the market should react from one of this places i mention, pls be aware never ever take the trade before NFP /15 min before / always wait NFP and market will gave u other entry after 45 to 60 min after NFP dont be gambler and put all ur heart . Wait like pro and take trade after nfp 45 to 60 min be safe much love and respect
any question fell free to ask id like to answer any Questions
DOW JONES INDEX (US30): Bearish More From Resistance
It looks like US30 is returning to a bearish trend again.
I see a strong bearish sentiment after a test of a key daily resistance.
The price formed an inverted cup and handle pattern and we see
a strong bearish imbalance with London session opening.
Goal - 39.685
❤️Please, support my work with like, thank you!❤️
I am part of Trade Nation's Influencer program and receive a monthly fee for using their TradingView charts in my analysis.

Falling towards 61.8% Fibonacci support?DJ30 is falling towards the support level which is a pullback support that lines up with the 61.8% Fibonacci retracement and could bounce from this level to our take profit.
Entry: 37,602.11
Why we like it:
There is a pullback support level that lines up with the 61.8% Fibonacci retracement.
Stop loss: 36,538.75
Why we like it:
There is a pullback support level.
Take profit: 39,559.66
Why we like it:
There is a pullback resistance level that lines up with the 50% Fibonacci retracement.
Enjoying your TradingView experience? Review us!
Please be advised that the information presented on TradingView is provided to Vantage (‘Vantage Global Limited’, ‘we’) by a third-party provider (‘Everest Fortune Group’). Please be reminded that you are solely responsible for the trading decisions on your account. There is a very high degree of risk involved in trading. Any information and/or content is intended entirely for research, educational and informational purposes only and does not constitute investment or consultation advice or investment strategy. The information is not tailored to the investment needs of any specific person and therefore does not involve a consideration of any of the investment objectives, financial situation or needs of any viewer that may receive it. Kindly also note that past performance is not a reliable indicator of future results. Actual results may differ materially from those anticipated in forward-looking or past performance statements. We assume no liability as to the accuracy or completeness of any of the information and/or content provided herein and the Company cannot be held responsible for any omission, mistake nor for any loss or damage including without limitation to any loss of profit which may arise from reliance on any information supplied by Everest Fortune Group.

Us30 LongWe have a fresh/original zone at 40150 of which i expect price to pull back to and reject it and continue with the rally

DJ is setting up for a SLINGSHOT to the upside!The "crash" in the DJ could potentially bottom out by late April or early May, at least from a cyclical standpoint. That said, there's still a risk of a further decline into June, as a panic cycle is approaching.
However, from a technical perspective, the weekly chart of the DJ reveals a significant demand imbalance that aligns with cyclical support, suggesting the potential for a major low.
Regardless, the stage is being set for a SLINGSHOT to the upside, as capital begins to flee Europe and flow into the U.S. amid rising global tensions and uncertainty.
Both the DJ and Gold are poised to reach new all-time highs ahead!

UPDATE: The Great Depression 2025–2036 for DJIUPDATE: The Great Depression 2025–2036 for DJI
Here is a revised analysis compared to the one from January this year. In that earlier analysis, I was still anticipating a sharp drop to 6,500 points. However, it now seems that the 6,500 level will not be reached. I do expect the DJI to decline to 17,000 points through an ABCDE structure. This structure could potentially take 15 to 20 years to unfold.

US30Taking advantage of the bear market on indices we’re going to wait for it to break this key level, retest then take our entries on the smaller timeframe

US30 — Support Holding or Further Drop? Key Levels To WatchUS30 (Dow Jones) — 4H Chart
Price is currently hovering around a key support zone near 37,000 after a strong bearish impulse.
Scenarios I'm Watching:
▸ Bullish Scenario:
If the support zone holds and price reclaims 37,500 — I would look for price to retest the 38,300-38,800 zone.
A clean break and hold above 39,500 could open doors towards the 40,000-41,000 resistance area.
▸ Bearish Scenario:
If price fails to hold this support, and breaks below 36,850 — I expect further downside towards the next key supports:
35,800
34,500
33,000
Trading Plan:
Waiting for clear price action confirmation at this support zone.
Will avoid trading in the middle of the range — prefer breakout or retest setups.
Levels marked on chart for clarity.
If you found this analysis valuable, kindly consider boosting and following for more updates.
Disclaimer: This content is intended for educational purposes only and does not constitute financial advice.

Falling towards pullback support?Dow Jones (US30) is falling towards the pivot and could bounce to the 50% Fibonacci resistance.
Pivot: 37,575.10
1st Support: 36,424.90
1st Resistance: 39,614.90
Risk Warning:
Trading Forex and CFDs carries a high level of risk to your capital and you should only trade with money you can afford to lose. Trading Forex and CFDs may not be suitable for all investors, so please ensure that you fully understand the risks involved and seek independent advice if necessary.
Disclaimer:
The above opinions given constitute general market commentary, and do not constitute the opinion or advice of IC Markets or any form of personal or investment advice.
Any opinions, news, research, analyses, prices, other information, or links to third-party sites contained on this website are provided on an "as-is" basis, are intended only to be informative, is not an advice nor a recommendation, nor research, or a record of our trading prices, or an offer of, or solicitation for a transaction in any financial instrument and thus should not be treated as such. The information provided does not involve any specific investment objectives, financial situation and needs of any specific person who may receive it. Please be aware, that past performance is not a reliable indicator of future performance and/or results. Past Performance or Forward-looking scenarios based upon the reasonable beliefs of the third-party provider are not a guarantee of future performance. Actual results may differ materially from those anticipated in forward-looking or past performance statements. IC Markets makes no representation or warranty and assumes no liability as to the accuracy or completeness of the information provided, nor any loss arising from any investment based on a recommendation, forecast or any information supplied by any third-party.

#US30 – Bearish Breakdown from Rectangle Pattern | 1D AnalysisThe Dow Jones Industrial Average (DJIA) has completed a breakdown from a rectangle consolidation pattern, signaling a potential bearish continuation. The index is currently trading around 41,790, with downside momentum increasing.
Technical Analysis:
Rectangle Pattern Breakout – Bearish continuation after range-bound movement
Double Top Formation – Confirmed rejection near 45,000 resistance
Projected Target: 38,000 (as per the pattern breakdown)
Immediate Resistance: 42,000 - 43,200
Fundamental Outlook:
Market sentiment affected by interest rate policy & economic uncertainty
Weak earnings reports and recession fears could add further downside pressure
If DJIA remains below resistance, we could see further declines toward 38,000. However, a break back above 43,200 could invalidate the bearish setup. Watch for volume confirmation and macroeconomic developments!

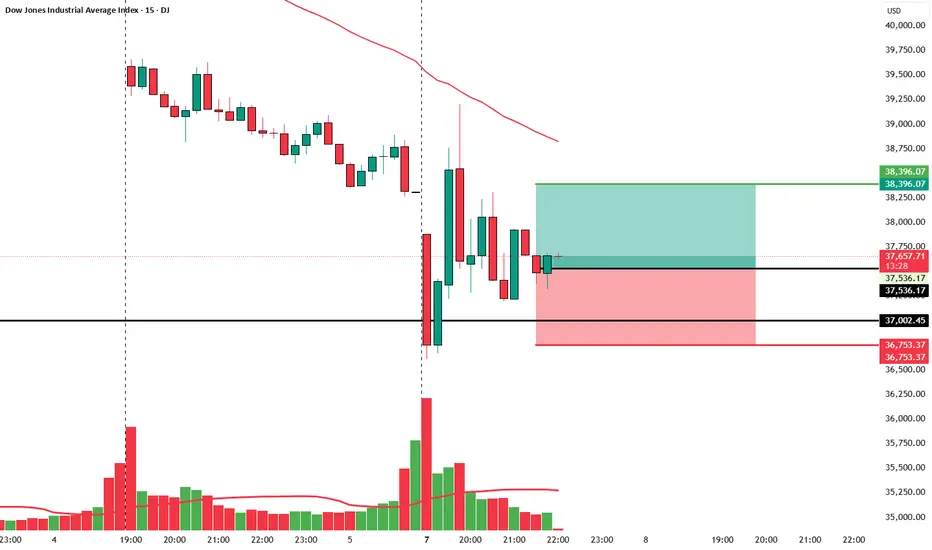
TRADE IDEA: US30 LONG ( BUY LIMIT )
Daily Chart:
• RSI: At 24.33, it’s in oversold territory — potential for a reversal.
• MACD: Strong bearish momentum, but the histogram may be bottoming out, signaling a potential bullish divergence forming.
• Price Action: Testing key support zone near 38300, which was previously a resistance-turned-support area.
15-Minute Chart:
• RSI: At 60.68, indicating early bullish momentum.
• MACD: Bullish crossover recently occurred; histogram rising — confirming short-term upward trend.
• Price Action: Clear bounce from recent lows with higher highs and higher lows forming.
3-Minute Chart:
• Momentum clearly shifting up.
• Price moving above short-term moving average, showing intraday strength.
⸻
Fundamental Context:
• US economic data has recently shown mixed signals, but dovish Fed tone and potential rate cuts in the near future favor equity indices recovery.
• No major bearish macro headlines present at this time to sustain the steep drop.
⸻
Trade Parameters:
• Entry: 38,390 (current price zone, confirming strength above local consolidation)
• Stop Loss (SL): 38,000 (below recent lows and psychological level)
• Take Profit (TP): 39,190 (previous supply zone, daily EMA resistance area)
• Risk: 390 points
• Reward: 800 points
• RRR: 2.05:1
FUSIONMARKETS:US30

Dow Jones INTRADAY oversold bounce back Dow Jones INTRADAY oversold bounce back
Key Support and Resistance Levels
Resistance Level 1: 40617
Resistance Level 2: 42165
Resistance Level 3: 44073
Support Level 1: 37555
Support Level 2: 36620
Support Level 3: 35125
This communication is for informational purposes only and should not be viewed as any form of recommendation as to a particular course of action or as investment advice. It is not intended as an offer or solicitation for the purchase or sale of any financial instrument or as an official confirmation of any transaction. Opinions, estimates and assumptions expressed herein are made as of the date of this communication and are subject to change without notice. This communication has been prepared based upon information, including market prices, data and other information, believed to be reliable; however, Trade Nation does not warrant its completeness or accuracy. All market prices and market data contained in or attached to this communication are indicative and subject to change without notice.

Intraday entry 1Everything is pretty much explained in the picture itself.
I am Abhishek Srivastava | SEBI-Certified Research and Equity Derivative Analyst from Delhi with 4+ years of experience.
I focus on simplifying equity markets through technical analysis. On Trading View, I share easy-to-understand insights to help traders and investors make better decisions.
Kindly check my older shared stock results on my profile to make a firm decision to invest in this.
Kindly dm for further assistance it is for free just for this stock.
Thank you and invest wisely.
DOW JONES Will the 1week MA200 save the day?Dow Jones / US30 almost reached its 1week MA200 today and immediately rebounded.
Last time it approached it so closely was on October 23rd 2023 and last it crossed under it was September 19th 2022.
The most recent was the first higher low of the 3 year Channel Up and the latter was the bottom of the last bear market.
The 1week RSI hasn't been this low since June 13th 2022, which was again a near 1week MA200 test that caused an immediate rebound to the 1week MA50 before the rejection to the eventual bear market bottom.
As long as the 1week MA200 holds and closes the candles over it, we expect the Channel Up to start a near bullish wave like post October 2023.
Target 45200 (same as the March 2024 rally) which is around the All Time High.
Follow us, like the idea and leave a comment below!!

US30: Absolute Price Collapse Ahead! Short!
My dear friends,
Today we will analyse US30 together☺️
The in-trend continuation seems likely as the current long-term trend appears to be strong, and price is holding below a key level of 37,395.0 So a bearish continuation seems plausible, targeting the next low. We should enter on confirmation, and place a stop-loss beyond the recent swing level.
❤️Sending you lots of Love and Hugs❤️

Dow Jones - Pivotal moment for the bulls and bears!The Dow Jones Industrial Average is currently approaching a critical juncture, as it risks breaking below and staying under the neckline of a potential double top pattern. A double top formation is typically a bearish signal, indicating a potential trend reversal after the price tests a key resistance level twice, failing to break higher. The neckline, which forms the base of this pattern, is the level that traders will be watching closely to determine the strength of this bearish signal.
If the Dow breaks below and stays under the neckline, it could trigger further downside momentum as liquidity is swept from the market. However, it's essential to note that this initial breakdown could just be a "liquidity sweep," a move designed to trigger stop-loss orders and shake out weaker hands. For the Dow to maintain its bullish potential, it must quickly recover and hold above the neckline after this sweep. If it can do so, the market may find stability and begin to look for higher prices again, as the double top formation would then be invalidated, and a more bullish outlook could emerge.
In summary, while the Dow Jones is at a pivotal moment, the key to higher prices will be whether it can hold above the neckline after sweeping liquidity. A failure to do so could signal further downside, but a strong recovery above the neckline would leave the door open for a potential rally.
For now the Dow jones swept the liquidity under the neckline. However, it needs a quick recovery to maintain and find support on the neckline again. The risk that it now faces is the resistance of the 50, 100 and 200-day MA. Staying above the neckline and reclaiming these MA could be a massive bullish signal on the Dow Jones.
Thanks for your support.
- Make sure to follow me so you don't miss out on the next analysis!
- Drop a like and leave a comment!
Lets chat in the comment section. See you there :)

THE BIGGEST FALL EVER, WINTER IS COMING? US30 timeframe 4hHi there. I'm here with new analyze of US30.i think its bearish again, do u think its going to make a biggest bearish trend? lets discuss about it

Easy tricks to master you mind during correctionsHello,
The markets have been correcting, and fear seems to be creeping in. What most investors fail to understand is that big corrections such as this are the best opportunities handed to them. This is the best time to buy since markets are trading at the bottom. Additionally, for this time earnings season is about to kick in while this time the market is trading at the bottom. We compiled a few things that can help you remain composed in the current market environment.
A transformative book I would recommend is Trading in the Zone by Mark Douglas. Douglas brilliantly compares elite traders to world-class athletes, revealing that both achieve greatness not through luck, but through rigorous mental discipline and robust, repeatable systems. To guide you toward this coveted "zone" of peak performance, here are four indispensable strategies:
Craft a Rock-Solid Trading Plan
A well-defined trading plan is your compass in the chaotic wilderness of the markets. It spells out precise conditions for entering trades, selecting opportunities, and exiting positions. By faithfully following this blueprint, you anchor yourself in accountability, sidestepping the pitfalls of reckless, emotion-driven moves.
Maintain a Detailed Trading Journal
Think of your trading journal as a mirror reflecting your journey. Record every trade, emotion, and market insight. This disciplined habit empowers you to evaluate your performance, pinpoint weaknesses, and sharpen your approach—unlocking a deeper understanding of your own psychological triggers.
Cultivate Confidence Through Realistic Goals
Confidence isn’t bravado—it’s the quiet strength to take calculated risks and embrace the results. Build it by practicing on a demo account with the seriousness of real stakes, setting attainable targets, and celebrating small wins. This foundation turns uncertainty into opportunity.
Master the Art of Risk Management
In trading, protecting your capital is paramount. Embrace proven techniques like setting risk/reward ratios, deploying stop losses, and sizing positions sensibly. These habits don’t just shield you from ruin—they pave the way for consistent, long-term gains.
With the above rules we believe you should be able to invest or remain invested during these volatile moments. Again, remember the tariffs that have been set are the ceiling and we expect concessions to come once negotiations between countries begin.
Good luck and stay invested. As shown in the chart, this is not the first time the market is undergoing a significant correction. What's clear is that markets always recover from corrections and continue pushing higher. This further reinforces our conviction that this are the best times to begin buying.
Disclosure: I am part of Trade Nation's Influencer program and receive a monthly fee for using their TradingView charts in my analysis.
