Dow Jones And The Law Of The SeaThe financial markets are setup in a way that symbolizes the Ocean and follows the Law of the Sea.
Your cash is a LIQUID asset that is sat in a riverBANK. Your cashFLOW is used for LIQUIDITY when you purchase an asset. The banks direct the flow of money or CURRENT(cy).
Inflation = inflatable rescue craft used when a debtor/dead ore has lost its charge.
When currency is used, it loses its value or its battery gets depleted. The inflatable craft must be blown up with more fresh air "currency" or to put simply, to print more money.
The word check is literally the meaning of KING in Persia. This is why in chess, when the king is in danger of being eliminated, you say CHECK. This means to cut a king.
When you are looking for a good price to buy, you are looking for a good DEAL. A deal is in ancient maritime commerce, a plank of softwood timber used on the deck of the ship. In commerce, it used as buying or selling. To get a good deal, refers to a certain area on the ship where goods were sold. The deals were made literally on the deals of the merchant ships. This is why in business they "cut" you a deal, because the timber of the ships needed to be cut. Just like a "Deck" of cards the "dealer" deals you.
There is more to this ancient story and how ALL financial terms and system is setup using Maritime Law
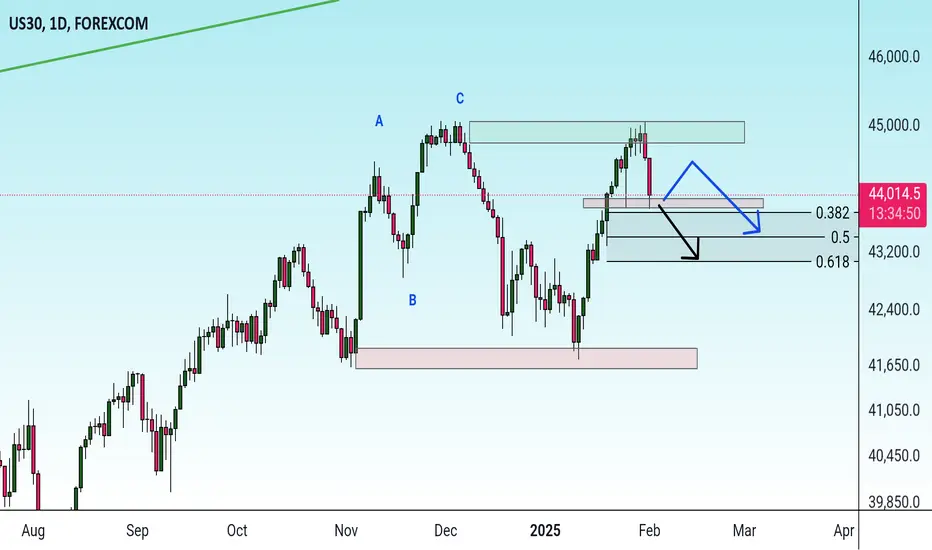
US30 trade ideas

US30 created a bullish opportunity after a market correctionUS30 created a buying opportunity after opening the trading day below closing of last friday by over 200 pips. This gave a buying opportunity as price often fills any gaps created by the market.

US30-Bias short pair has made a strong bearish divergence and head and shoulder formation in 5 min chart,in 15 MA 200 is getting respected and shooting star formation followed by the bearish engulfer candle.
Major resistance respected at 44509 ,Support has broken at 44352
FIb level 0.618 is being respected at 44509 which indicates fall expected.
Trade plan bias short @ 44350
SL:44531
TP1:44208
TP2:44155

time for sell DOWits a good time to sell dow jones i think wave Y has ended almost and we can think of selling this savage!!!sell wid sl guys and tp is personal

DOW JONES: Buy signal above the 4month RectangleDow Jones just turned bullish on its 1D technical outlook (RSI = 56.676, MACD = 255.440, ADX = 30.051) as it hit the 4H MA50 after an instant rebound on the 4H MA100 inside the same session. This is a strong bullish reversal but the buy signal will be validated if the price crosses over the 4month Rectangle pattern. The rally from its January 13th bottom has been with a significant correction until Friday's and today so far and according to the November rally which was two-fold, if this is the start of the 2nd bullish stage, it should be -1.70% weaker than the first. This implies that from today's low we should rise by +6.30%. This gives us a TP = 46,550 but in order to overcome the bearish pressure of the Rectangle, we will buy only if then price crosses over it.
See how our prior idea has worked out:
## If you like our free content follow our profile to get more daily ideas. ##
## Comments and likes are greatly appreciated. ##

POSSIBLE SET UP ON US30All the details are marked on chart so far no break of structure therefore 45000 level is very important for any upward move we need to have positive closure above 45000 level upcoming week alot of economic data is on card all the levels are marked on chart will take entries only upon confirmation US30 went up from 42000 level but failed to sustain above 45000 which is of significance importance however on monthly timeframe it closed above 80% of range another important aspect therefore will look for small entries till the time its consolidating between 41000-45000
Note: Only for educational purpose not an investment advice

WALL STREET LONGAll timeframes are oversold and there is a lot of divergnece
There is no pattern but this is with the trend
100 pip stop loss
entered at 43895
Take half at M15 overbought

Tariffs, tariffs and more tariffs... What's next for the Dow?It seems like we are stepping into Tariff Wars 2.0, with the announcement of the tariffs on Canada, Mexico and China. But is the outlook really that bad? Let's take a look at the MARKETSCOM:US30 scenario.
TVC:DJI
74.2% of retail investor accounts lose money when trading CFDs with this provider. You should consider whether you understand how CFDs work and whether you can afford to take the high risk of losing your money. Past performance is not necessarily indicative of future results. The value of investments may fall as well as rise and the investor may not get back the amount initially invested. This content is not intended for nor applicable to residents of the UK. Cryptocurrency CFDs and spread bets are restricted in the UK for all retail clients.

DOW JONES INDEX (US30): Bullish Outlook Explained
It feels like US30 index is preparing to recover
after Friday's and today's selloff.
As a confirmation, I see a nice bullish imbalance
after a test of a daily support and a tiny ascending triangle
pattern on an hourly.
Goals: 44196 / 44470
❤️Please, support my work with like, thank you!❤️

Pullback up, with a potential long opportunityDow Jones managed to breach the 45k mark but failed to sustain its upward pressures. Price action will try to erase the current sell-off, testing the above highs again. Settling above 45,000 will see the indice grow, remaining below this mark may continue to bring bearish interest.

Downtrend It is expected that the continuation of the downward trend will be formed according to the specified paths and will pass the support range.
YM (US30): Trend in daily time framePlease pay special attention to the accurate trend, channel, and colored levels.
Its very sensitive setup, ...............<<<<<<<<<<<<<<<<<<<<<<<
Be careful
BEST
MT

US30 H4 | Bounce Off the 50% FiboBased on the H4 chart analysis, the price is approaching our buy entry level at 43,280.46, which is a significant overlap support that aligns close to the 50% Fibonacci retracement.
Our take profit is set at 44,575.46, a pullback resistance level.
The stop loss is placed at 42,602.17, a pullback support level.
High Risk Investment Warning
Trading Forex/CFDs on margin carries a high level of risk and may not be suitable for all investors. Leverage can work against you.
Stratos Markets Limited (fxcm.com/uk):
CFDs are complex instruments and come with a high risk of losing money rapidly due to leverage. 63% of retail investor accounts lose money when trading CFDs with this provider. You should consider whether you understand how CFDs work and whether you can afford to take the high risk of losing your money.
Stratos Europe Ltd (fxcm.com/eu):
CFDs are complex instruments and come with a high risk of losing money rapidly due to leverage. 63% of retail investor accounts lose money when trading CFDs with this provider. You should consider whether you understand how CFDs work and whether you can afford to take the high risk of losing your money.
Stratos Trading Pty. Limited (fxcm.com/au):
Trading FX/CFDs carries significant risks. FXCM AU (AFSL 309763), please read the Financial Services Guide, Product Disclosure Statement, Target Market Determination and Terms of Business at fxcm.com/au
Stratos Global LLC (fxcm.com/markets):
Losses can exceed deposits.
Please be advised that the information presented on TradingView is provided to FXCM (‘Company’, ‘we’) by a third-party provider (‘TFA Global Pte Ltd’). Please be reminded that you are solely responsible for the trading decisions on your account. There is a very high degree of risk involved in trading. Any information and/or content is intended entirely for research, educational and informational purposes only and does not constitute investment or consultation advice or investment strategy. The information is not tailored to the investment needs of any specific person and therefore does not involve a consideration of any of the investment objectives, financial situation or needs of any viewer that may receive it. Kindly also note that past performance is not a reliable indicator of future results. Actual results may differ materially from those anticipated in forward-looking or past performance statements. We assume no liability as to the accuracy or completeness of any of the information and/or content provided herein and the Company cannot be held responsible for any omission, mistake nor for any loss or damage including without limitation to any loss of profit which may arise from reliance on any information supplied by TFA Global Pte Ltd.
The speaker(s) is neither an employee, agent nor representative of FXCM and is therefore acting independently. The opinions given are their own, constitute general market commentary, and do not constitute the opinion or advice of FXCM or any form of personal or investment advice. FXCM neither endorses nor guarantees offerings of third-party speakers, nor is FXCM responsible for the content, veracity or opinions of third-party speakers, presenters or participants.

Us30 bearish bias based on the chart, price looks to be in a bearish state and resultantly looks like it's going to continue the trend. Price is currently sitting near the daily support level at 44 479,22, thus there is anticipation for a rise which will see price test the fair value gap at 44 678,12 before shorting all the way back to the support level at 44 479,22. Further on I anticipate price to break below the support level 44 479,22. A retest of this area after a break of structure will serve as confirmation of price continuing the downtrend which will see price fall all the way to the weekly support at 43 806,98. The first target will be a short from 44 671,00 with stop loss at 44 719,09 and tp at 44 520,00. The second target is also a short at 44 474,78 with stop loss at 44 501,13 and tp at 43 962,13.

Potential bearish drop?DJ30 is reacting off the support level which is an overlap support that is slightly above the 50% Fibonacci retracement. A breakout of this level could lead the price to drop to our take profit.
Entry: 44,553.18
Why we like it:
There is an overlap support level that is slightly above the 50% Fibonacci retracement.
Stop loss: 45,112.98
Why we like it:
There is a pullback resistance level.
Take profit: 44,041.83
Why we like it:
There is a pullback support level.
Enjoying your TradingView experience? Review us!
Please be advised that the information presented on TradingView is provided to Vantage (‘Vantage Global Limited’, ‘we’) by a third-party provider (‘Everest Fortune Group’). Please be reminded that you are solely responsible for the trading decisions on your account. There is a very high degree of risk involved in trading. Any information and/or content is intended entirely for research, educational and informational purposes only and does not constitute investment or consultation advice or investment strategy. The information is not tailored to the investment needs of any specific person and therefore does not involve a consideration of any of the investment objectives, financial situation or needs of any viewer that may receive it. Kindly also note that past performance is not a reliable indicator of future results. Actual results may differ materially from those anticipated in forward-looking or past performance statements. We assume no liability as to the accuracy or completeness of any of the information and/or content provided herein and the Company cannot be held responsible for any omission, mistake nor for any loss or damage including without limitation to any loss of profit which may arise from reliance on any information supplied by Everest Fortune Group.

US30We Looking For Selling Opportunities As The Market Has Broken Outside The Bearish Trend Resulting In A Change Of Trend Which Indicates Upcoming Sells| 1HR TIMEFRAME

DOW JONES - Long after filling the imbalance !!Hello traders!
‼️ This is my perspective on DOW JONES.
Technical analysis: Here we are in a bullish market structure from 4H timeframe perspective, so I look for a long. I wait price to continue the retracement to fill the imbalance and then to reject from bullish OB around 44,000.
Like, comment and subscribe to be in touch with my content!


Dow Jones Trading IdeaBased on Simple Technical Analysis ( Trendline + Support & Resistance )
Risk Disclaimer:
Please be advised that I am not telling anyone how to spend or invest their money. Take all of my analysis as my own opinion, as entertainment, and at your own risk. I assume no responsibility or liability for any errors or omissions in the content of this page, and they are for educational purposes only. Any action you take on the information in this analysis is strictly at your own risk. There is a very high degree of risk involved in trading. Past results are not indicative of future returns. Good luck :-)

SELLS ON US30We are tapping into a HTF resistance. We can either break through or reject. It also depends on the fundamentals next week that will determine whether in line with technicals

US30 Analysis: Liquidity Zones, FVGs & Trendline Support
This is personal breakdown of the US30 price action, focusing on key liquidity areas, fair value gaps (FVGs), and potential reactions.
Key Observations:
📌 Current Price: 44,552.4
📉 Recent High: 44,960 (Liquidity grab at resistance)
📈 Recent Low: 44,530 (Testing key support)
Market Structure:
-Liquidity Engineering:
-LEG1:Sharp move up, creating imbalance.
- LEG2:Range formation, followed by a strong sell-off into FVG.
-Trading Range:
-Resistance: 44,960 - 45,000 (Liquidity zone)
-Support: 44,500 - 44,400 (Demand area + FVG)
Fair Value Gaps (FVGs):
-30-Minute FVG: 44,390 - 44,450 (Potential demand zone)
-4-Hour FVG: 44,200 - 44,300 (Deeper liquidity pool)
Trendline Support:
-Uptrend Line: Aligns around 44,350 - 44,400, adding confluence to the FVG zone.
Bearish Momentum:*
- The price has broken down from the trading range and is testing liquidity levels.
- If the 4,400 zone holds, we may see a reaction toward 44,700 - 44,900.
- If it fails, next downside targets are 44,300 - 44,200.
⚠️ Disclaimer: This is NOT financial advice—just personal market analysis. Always do your own research before making any trading decisions.

US30 Analysis: Is This Resistance the Turning Point?👀 👉 In this video, we conduct an in-depth analysis of US30, dissecting its prevailing uptrend and the recent retracements from resistance. We’ll examine key support and resistance zones, market structure, and price action behavior to identify potential trade scenarios. With price nearing a significant resistance level, we assess possible countertrend opportunities—provided price action aligns with our technical outlook. Watch now for a comprehensive breakdown. This analysis is for educational purposes only and should not be considered financial advice.

Dow Jones index Wave Analysis – 31 January 2025
- Dow Jones reversed from strong resistance level 45000.00
- Likely to fall to support level 44235.00
Dow Jones index today reversed down from the resistance area located between the strong resistance level 45000.00 (which stopped the previous multi-month uptrend in November) and the upper daily Bollinger Band.
The downward reversal from this resistance area will most likely form the daily Bearish Engulfing – if the price closes today near the current levels.
Given the strength of the resistance level 45000.00 and the overbought daily Stochastic, Dow Jones index can be expected to fall to the next support level 44235.00.
