Nas100 SELL to 17.5k*I am in no way a financial advisor and you should always do your own due diligence before placing any trade. Do not trade what you are not comfortable with losing. No trade is guaranteed.
SL 19,977
TP 17,500
USTEC trade ideas

NAS100 Analysis: Potential higher timeframe pullback in playOn the higher timeframe, NAS100 remains bullish. However, recent price action suggests that a higher timeframe pullback may be underway, providing a discounted price opportunity.
On the daily chart, a market structure shift occurred when NAS100 broke below the 20,477 level. The most recent price action indicates a short-term pullback to the upside on lower timeframes, potentially to mitigate the internal supply zone and reach premium price levels.
I am closely watching the 61.80% Fibonacci retracement level around 21,028 for potential selling opportunities, with downside targets at 19,113 and 18,297.
How Are You Trading NAS100 This Week?
Share your thoughts in the comments!
If you found this analysis helpful, please support it with a boost. Also, follow for more updates!

NAS100 Sell-Off Isn't Over Yet! | Watch This Key Level for the NAfter a major sell-off, NAS100 still shows strong bearish potential. We're currently seeing price consolidate in a 4-hour range, and all eyes should be on a potential pullback to the trendline or range high. In this video, I break down exactly what I’m watching for the next high-probability short opportunity.

the bull are coming on NASDAQNew week lets prepare for the week , nasdaq i am expecting a push to 19 900 and i will pay attention around that price, how the market will react

NDX using HiLo Ema Squeeze bandsUsing Hio Ema Squeeze band you can quickly find support/resistance levels as confirmed here with the trend lines. Here I have used 1000 for all the bands, this makes it look cleaner.
Another trick is use two bands one with 200,1000,1000 and the other with 1000,1000,1000 and you will double squeeze bands resulting in one with 200 and other with 1000

Nasdaq 3DThe price is moving within an ascending channel and, after a retracement to its resting zone around the 0.5 and 0.618 Fibonacci levels, it is showing signs of a bullish reversal.
Given this structure, look for long trade opportunities in the lower timeframes in the upcoming week, especially if bullish price action confirmation appears.

NAS100 LONGSHi traders, please watch as I forecast the price & structure of NAS100:
-Price ready to surge
-Bullish momentum
-Expecting price to move in 3 waves
for the bullish impulse
-Key levels >20500
-Probability for bearish move to persist

NAS100 - Market BreakdownHi all,
Here we have NAS100 and we will be assessing what price has done and where it might be going
So far we can see that price has made a hard run down to sell side Liquidity, although we have seen some consolidation at this current zone we can also notice that price still has an area to fill further down with left over Imbalance
I would like to see either of the two following situations happen before getting into any trades
1. Rejection this Resistance level and take sell side Liquidity further down and reject the Demand zone from that level.
OR
2. Break out of this current consolidation range and break above resistance to further retest that level before looking for buy trades, in this situation we will have seen a Shift in the market taking out this Protected high of which would give me confluence to buy
Follow me if you would like to see more or message for any questions.
Cheers and good luck

Nasdaq 100: First Stage of a Major CorrectionThe Nasdaq 100 has plummeted over 11% from its record high of 22,222. With prices now testing key support at 19,437, the index closed slightly higher at 19,753 (+0.39%) on Friday. However, weakness remains evident, indicating the first stage of a potential major correction. Historically, corrections unfold in four stages as part of a healthy market reset.
If support at 19,437 holds, a short-lived rebound could target 19,932, 20,054, 20,433, 20,744, and potentially 21,050. Failure to maintain this level could trigger stage two, aiming for 17,825. Historical patterns suggest a possible four-stage correction of around 33%, targeting approximately 14,835.

US100 NASDAQ TRADE IDEA 24 MARCH 2025The Nasdaq 100 (US100) recently broke below its long-term ascending channel, signaling a potential shift in market structure. A Break of Structure (BOS) around the 19,800 level suggests that sellers are taking control, with a possible retest of the 19,700 - 20,200 supply zone before further downside. The price action indicates a liquidity grab above 20,758, followed by strong bearish momentum, confirming institutional participation. Additionally, a fair value gap (FVG) between 19,000 - 18,155.9 suggests that price may seek to fill this imbalance before reaching demand at 18,155.9 - 17,699.3, with a deeper support zone at 16,572.0 acting as a key target for bearish continuation.
From a fundamental perspective, ongoing US-China trade tensions, particularly restrictions on semiconductor exports, could weigh on major tech stocks such as Nvidia and AMD. If China retaliates with bans on rare-earth metal exports, it could disrupt global supply chains, further pressuring the Nasdaq 100. Additionally, Federal Reserve policy uncertainty plays a crucial role. If inflation remains stubbornly high, the Fed may delay rate cuts, leading to higher bond yields, which typically make riskier tech stocks less attractive. This environment could drive further downside for Nasdaq-listed companies. Moreover, the upcoming earnings season presents another risk. If major tech firms like Apple, Microsoft, and Google report weaker-than-expected earnings or issue cautious forward guidance, investor sentiment could deteriorate, accelerating the bearish trend.
Given this confluence of technical and fundamental factors, a short trade setup becomes favorable. The ideal entry would be around the 19,700 - 20,200 supply zone, with a stop-loss above 20,500 to invalidate the bearish setup. Take profit targets include 18,155.9 (first demand zone), 17,699.3 (major liquidity level), and 16,572.0 (higher timeframe support and strong demand zone). However, if price reclaims 20,500+, a bullish reversal may occur, with potential upside towards 22,138.3. This trade aligns both Smart Money Concepts (SMC) and supply and demand principles, while also factoring in macroeconomic risks that could influence Nasdaq 100 price action in the coming weeks.

Nasdaq Long then Short on 4th wave "Triangle"In my previous video, I mentioned that I expected 4th wave to have completed. However, the latest wave structure made me reconsider that I may be too early yet again. Thus, I SHIFTED the e wave of wave 4.
In this idea, you can see that I also drew a parallel channel. The purpose of which is to give an approximation on where the wave 4 will actually end before we proceed with Wave 5.
Good luck!

US100 18.03.2025 ~+ Scott Bessent's "corrections are necessary"
* Market structure on 1h is also very compelling

NSDQ100 The Week Ahead 24th March '25NSDQ100 bearish & oversold, the key trading level is at 20090
This communication is for informational purposes only and should not be viewed as any form of recommendation as to a particular course of action or as investment advice. It is not intended as an offer or solicitation for the purchase or sale of any financial instrument or as an official confirmation of any transaction. Opinions, estimates and assumptions expressed herein are made as of the date of this communication and are subject to change without notice. This communication has been prepared based upon information, including market prices, data and other information, believed to be reliable; however, Trade Nation does not warrant its completeness or accuracy. All market prices and market data contained in or attached to this communication are indicative and subject to change without notice.

Bulls game over now 16771 incoming Monthly TF down move incoming.. Short from 21000 Tp 16771.. Good luck and safe trade

US100 SENDS CLEAR BEARISH SIGNALS|SHORT
US100 SIGNAL
Trade Direction: short
Entry Level: 19,765.3
Target Level: 19,601.3
Stop Loss: 19,874.3
RISK PROFILE
Risk level: medium
Suggested risk: 1%
Timeframe: 1h
Disclosure: I am part of Trade Nation's Influencer program and receive a monthly fee for using their TradingView charts in my analysis.
✅LIKE AND COMMENT MY IDEAS✅

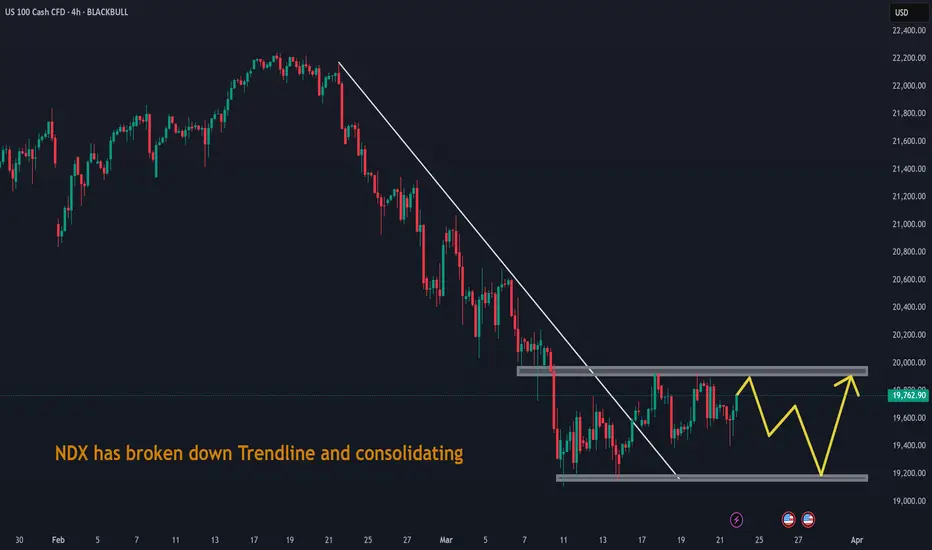
NDX has broken down Trendline and consolidatingNDX has broken down Trendline and consolidating in narrow zone.
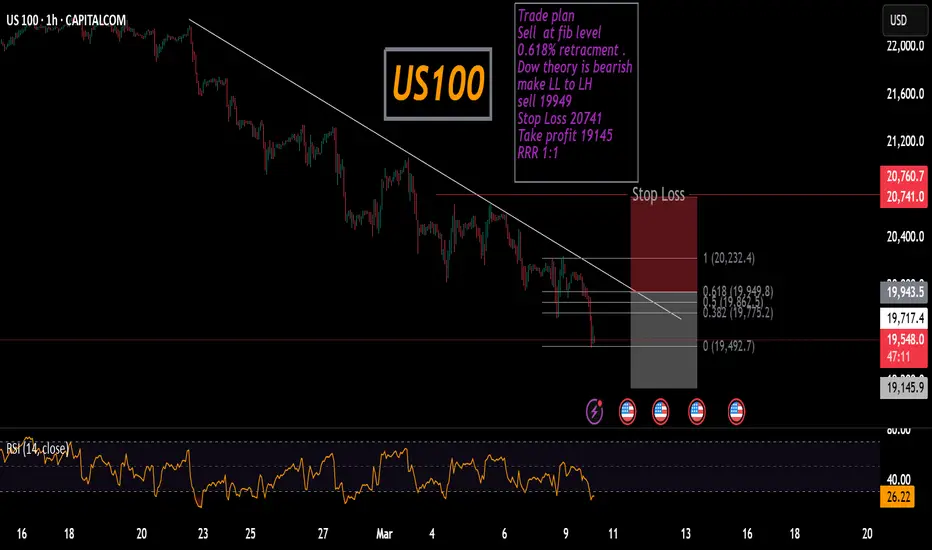
US100Trade plan
Sell at fib level 0.618% retracment .
Dow theory is bearish make LL to LH
sell 19949
Stop Loss 20741
Take profit 19145
RRR 1:1
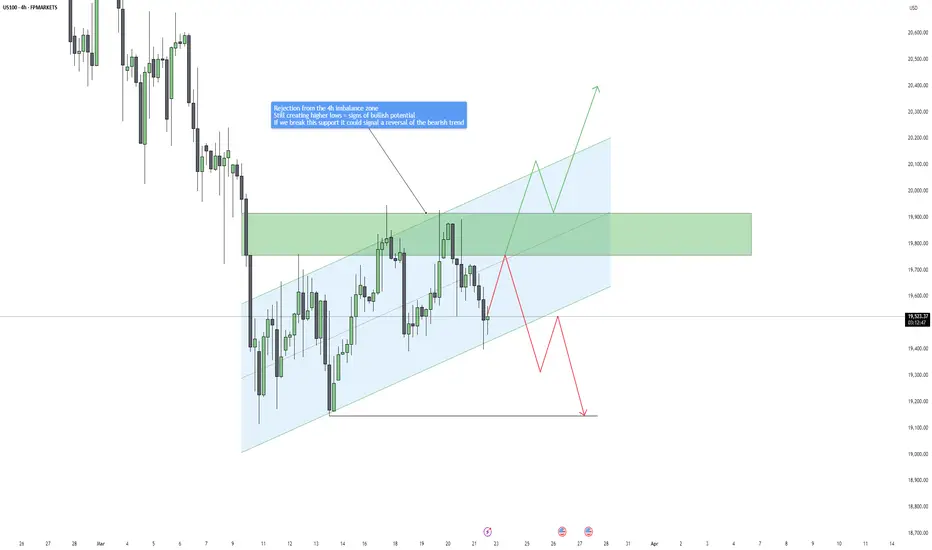
US100 - Testing Key Resistance: Will the 4H Trend Reverse?Market Structure & Trend Overview
The Nasdaq (US100) has been in a 4-hour uptrend, forming a series of higher lows and respecting an ascending channel after a prolonged bearish trend. This structure suggests that buyers are stepping in, and momentum may be shifting in favor of the bulls. However, the index remains at a critical decision point that could determine whether we see a confirmed bullish reversal or a continuation of the larger downtrend.
Key Zone: 4H Imbalance & Resistance Area
Currently, price action is testing a 4-hour imbalance zone, which has already acted as a strong resistance level twice. The market is struggling to break through this supply zone, which is crucial in determining the next major move. If price tests this area again and successfully breaks above it, it could confirm that buyers have gained control, signaling a potential trend reversal back into a bullish phase.
However, if price gets rejected from this level again, it could indicate that sellers are still dominant, increasing the probability of a breakdown from the ascending channel and a resumption of the bearish trend.
Bullish Scenario: Break & Hold Above Imbalance Zone
For a confirmed bullish reversal, Nasdaq must break above the imbalance zone with strong volume and sustain price action above it. A successful breakout could attract more buyers, leading to a push towards higher resistance levels, possibly targeting the $20,000 - $20,300 range in the short term.
Signs to look for in a bullish breakout:
✅ A decisive close above the imbalance zone with strong bullish momentum.
✅ Retesting the broken level as support, confirming it as a new demand zone.
✅ A continuation of higher highs and higher lows after the breakout.
Bearish Scenario: Breakdown of the Ascending Channel
If price fails to break through the imbalance zone and instead rejects for the third time, this could indicate a weakening bullish structure. The key support to watch is the lower boundary of the ascending channel. A confirmed break below this channel could invalidate the short-term uptrend, signaling a return to bearish price action.
If this occurs, Nasdaq could drop towards the key support level at $19,146, a previous liquidity zone where buyers may step in again.
Signs to watch for a bearish breakdown:
❌ A clear rejection from the imbalance zone.
❌ A break and close below the ascending channel.
❌ Increased selling pressure and a shift in market sentiment.
Final Thoughts: A Critical Inflection Point
Nasdaq is at a pivotal moment where the next move will determine the broader trend direction. If bulls can push price above the imbalance zone, we could see a confirmed bullish reversal with upside potential. However, if sellers regain control and force a breakdown of the channel, the downtrend is likely to continue, targeting the $19,146 level as a potential support zone.
Traders should closely monitor price action at the imbalance zone and the ascending channel boundaries, as these key areas will dictate the next major move. Whether we see a trend reversal or continuation, this setup presents significant trading opportunities in either direction.
Key Levels to Watch:
📍 Bullish Breakout Target: $19,900 - $20,000
📍 Bearish Breakdown Target: $19,146
__________________________________________
Thanks for your support!
If you found this idea helpful or learned something new, drop a like 👍 and leave a comment, I’d love to hear your thoughts! 🚀
Make sure to follow me for more price action insights, free indicators, and trading strategies. Let’s grow and trade smarter together! 📈
NAS still stuck in consolidation Market open is looking bearish on the session to end the week. Levels are clear but PA is stuck between the levels.
Share with those in need of a hand 🙏🏾

NAS100 SELL 1 HOUR TIME FRAMESupply Zone
Price is starting to break previous support zone
2:1 Risk Reward, Let's see!
NDX Trading-RoadMap
Weekly
• Context: Overall uptrend from 2022 is intact but under pressure as price slipped below some key weekly moving averages and trendline supports.
• Key Takeaway: The bigger picture has not fully turned bearish yet, but momentum has cooled. If the weekly chart remains above ~17,800–18,000, that “long‐term uptrend” viewpoint is still viable.
Daily
• Trend: Lower highs and lower lows (short‐term downtrend). Price is below the 200‐day SMA (~20,300) and also below the 50/100‐day SMAs (~21,000).
• Focus: Watch if price can reclaim the 200‐day SMA (20,200–20,700 zone) on a daily closing basis. That’s a major pivot for a potential reversal to the upside.
• Support: 19,000–19,200 is the near‐term floor; losing that puts 18,400–18,800 in play.
• Resistance: 19,900–20,100 (initial supply), then 20,200–20,700 (200‐day + Fib).
4H (Shorter‐Term)
• Recent Development: A bounce off ~19,150. MACD turned bullish on 4H, RSI improved from oversold.
• Trendline: The steep 4H downtrend line has been broken; price is testing overhead supply near 19,900–20,000.
• Key Focus: Does the 4H momentum carry price above 20,000+? If so, next stops are 20,200–20,700. If it stalls, watch for a return to ~19,200 or lower.
2. Key Levels to Track
1. Immediate Support Zones
• 19,600–19,700: Minor 4H pivot / mid Bollinger band on 4H.
• 19,000–19,200: Major short‐term floor; also a bullish order block from prior lows.
2. Deeper Supports
• 18,400–18,800: Strong demand if 19k fails.
• 17,800–18,000: Critical weekly zone, where the longer‐term uptrend would truly be at risk.
3. Immediate Resistance Zones
• 19,900–20,100: Overhead supply on Daily/4H; first real challenge for bulls.
• 20,200–20,700: Major confluence (200‐day SMA, Bollinger mid band on Daily, Ichimoku lower cloud boundary).
• 21,000–22,200: Larger daily/weekly supply if the index fully recovers.
4. Fibonacci Confluences
• From the larger swing: 50% retracement ~19,893.
• From the smaller daily swing: 23.6% ~19,886, 50% ~20,706.
• Keep an eye if price clusters or reverses around these fib levels.
3. Indicators You’ll Watch Each Day
• Daily Ichimoku: Price below the cloud → short‐term bias still bearish. A daily close back inside/above the cloud (~20,200–20,400) would be a significant bullish sign.
• Daily MACD: Still negative, but flattening. A bullish crossover on the daily could confirm the 4H bounce is turning into a multi‐day uptrend.
• Daily RSI: Hovering near 40–45. If it reclaims 50+, that’s a better sign of daily upside momentum.
• 4H MACD: Already bullish; watch if it remains that way or starts to roll over near resistance.
• 4H RSI: Currently ~45–50 or slightly higher. Over 60 would reinforce short‐term upside.
• Volume / OBV: See if up moves come on higher volume or if OBV slopes upward. That would show genuine buying pressure.
4. Daily Checklist / “If‐Then” Triggers
Use this section as a morning or intraday reference when you see price approaching certain zones.
A) Bullish Attempt
• IF price breaks above ~19,900–20,000 THEN:
• Check for 4H or daily candle close above that zone.
• Confirm if 4H MACD/RSI remain bullish.
• Potential next target: ~20,200–20,700.
• IF price subsequently closes above 20,200–20,300 THEN:
• This reclaims the 200‐day SMA → a bigger shift to bullish.
• Daily RSI likely near or above 50.
• Next target: ~21,000–21,500, with an eye on the 22k supply zone.
• IF 19,600–19,700 holds as support on a pullback, THEN watch for 4H bullish patterns to confirm a bounce. Potential to re‐attempt 19,900–20,000.
B) Bearish Continuation
• IF price rejects ~19,900–20,100 (4H or daily closes back under 19,600) THEN:
• Expect a drift back to test 19,200–19,000.
• Check if 4H RSI crosses below 40, MACD turns down again.
• If that zone fails, 18,800–18,400 is next support.
• IF daily closes below 19,000 THEN:
• The bullish bounce scenario is invalidated.
• Target a deeper move to 18,400–18,800, possibly 18,000 if momentum is strong.
5. What to Avoid
1. Over‐Leveraging: With the index near pivotal levels, volatility can spike. Keep position sizes within your risk tolerance.
2. Chasing Mid‐Zone: If price is between major zones (e.g., 19,600–19,700), entering randomly without a clear signal can lead to whipsaws. Wait for a confirmed break or test of a zone.
3. Ignoring Conflicting Timeframes: Weekly vs. Daily vs. 4H may conflict. If you see a 4H bullish signal but daily is still firmly bearish, manage risk accordingly (e.g., smaller size, quicker profit targets).
6. Risk Management & Positioning
• Stop Placement:
• For short‐term trades, use 4H ATR (~300 points) or place stops just beyond key swing highs/lows.
• For swing trades, consider daily ATR (~400–450 points) to avoid normal intraday noise.
• Targets:
• Set at least two profit objectives. For bullish trades, T1 near 20,200–20,300, T2 near 21k+. For bearish trades, T1 near 19k, T2 near 18.4k.
• Moving Stops to Breakeven:
• Once T1 is reached or a clear pivot forms in your favor, consider moving your stop to entry to lock in any open profit.
7. Potential News/Events That May Override Technicals
• U.S. Economic Data: Watch for major releases (CPI, Fed announcements, Tech sector earnings). These can create sudden volatility that breaks your technical zones.
• Global Sentiment Shifts: If risk aversion hits equity markets broadly, NDX could gap lower through supports. Alternatively, any strong bullish news in major tech names could swiftly break resistances.
8. Weekly Summary Action Plan
1. Check Weekly & Daily:
• Are we still below the daily 200‐SMA (~20,300)? If yes, short‐term momentum is likely bearish unless proven otherwise by the 4H breakout.
• Is the index forming a weekly candle that regains the prior trend channel or 50‐week SMA? That would be a bullish sign.
2. Monitor 19,900–20,100 & 19,000:
• These levels will dictate a lot of the week’s direction. A break above 20,000 on solid volume is your bullish trigger; a fail at 19,900 or a breakdown below 19,000 reaffirms the bearish narrative.
3. Intraday (4H) Observation:
• If price hovers between 19,600 and 19,900, remain cautious until a decisive push emerges.
• Use the 4H MACD/RSI to gauge if momentum is building up (or rolling over).
4. Risk Profile Guidance:
• Aggressive: Trade around 19,600–19,700 with tight stops, aiming for quick breaks.
• Moderate: Wait for 4H closes above or below key pivot zones (19,900–20,000 or 19,200–19,000).
• Conservative: Look for daily closes beyond 20,200 or under 19,000 before committing to positions.
5. Adapt & React:
• If you see a bullish break that fails intraday (price wicks above 19,900 but closes back below 19,600 on a 4H candle), that’s a potential short signal.
• Conversely, if price dips intraday to 19,200–19,300, but the 4H closes back above 19,600, that’s a potential bullish reversal cue.

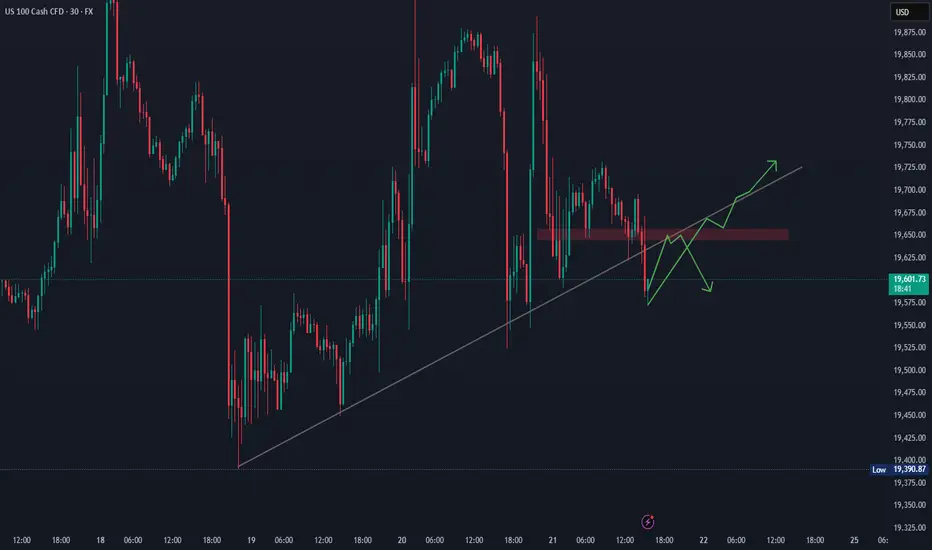
US30 UpdateIf we see a pullback around 19650 and then price rejecting that area again, it should open doors for more downside.
Conversely, if price breaks 19650, and we see a healthy 30 minute candle closing above that level, then we look to take some buy scalps from that zone.
Bearish Alert: Nasdaq’s Downtrend May Deepen Beyond 5%Hey Realistic Traders, Will CAPITALCOM:US100 Bearish Trend Stop? Let’s Dive In....
On the H4 timeframe, Nasdaq continues to follow the bearish trendline and the EMA-200 . Both trend analysis tools clearly signal a bearish trend. The downtrend may persist as a rising wedge pattern has formed, followed by a breakout and a MACD crossover.
Based on these technical signals, I anticipate a potential downward movement toward the first target at 19,077. After reaching this level, a minor pullback is likely before the decline continues toward a new low at 18,544.
This outlook remains valid as long as the price move below the stop-loss level at 20,080
Besides technical factors, U.S. President Donald Trump still intends to implement new reciprocal tariff rates on April 2, adding further uncertainty to the market. This could limit growth potential and contribute to an inflationary environment by increasing the cost of imported goods. Given this uncertainty, we believe the market will continue to decline.
Support the channel by engaging with the content, using the rocket button, and sharing your opinions in the comments below.
Disclaimer: "Please note that this analysis is solely for educational purposes and should not be considered a recommendation to take a long or short position on Nasdaq.
