USTEC trade ideas

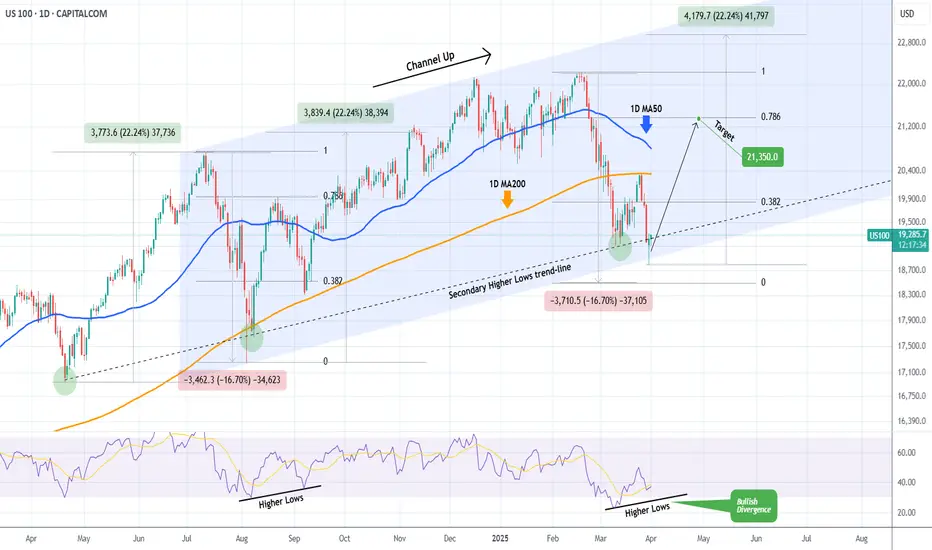
NASDAQ Huge Bullish Divergence points to 21350 inside April.Nasdaq (NDX) has been trading within a Channel Up pattern since the July 11 2024 High. The latest rally that started on March 11 2025 after a brutal 3-week downtrend/ Bearish Leg, got rejected on the 1D MA200 (orange trend-line) as the market digested the disappointing PCE.
Despite this aggressive rejection, the price hit and rebounded yesterday exactly at the bottom of the Channel Up with the previous such contact going back to the August 05 2024 Low. Not to mention that both the March 11 2025 and August 08 2024 Lows were formed exactly on the secondary Higher Lows trend-line.
What's perhaps more critical than any of these though, is that the 1D RSI didn't make a new Low last week and remains above the oversold barrier on a Higher Low trend-line that is a huge technical Bullish Divergence against the price's Lower Lows.
As with the August 22 2024 High, our first short-term Target is on the 0.786 Fibonacci retracement level at 21350.
-------------------------------------------------------------------------------
** Please LIKE 👍, FOLLOW ✅, SHARE 🙌 and COMMENT ✍ if you enjoy this idea! Also share your ideas and charts in the comments section below! This is best way to keep it relevant, support us, keep the content here free and allow the idea to reach as many people as possible. **
-------------------------------------------------------------------------------
💸💸💸💸💸💸
👇 👇 👇 👇 👇 👇
Will Trump Dump The Markets Again?The NASDAQ was able to recover temporarily today. Whether this recovery is sustainable remains questionable.
After the close of trading, Trump will announce his decisions on tariffs - turbulence is guaranteed.
The normalized RSI shows inverse bearish divergences in the area of an important order block, from which one could profit with the setup shown.

Nas100 - Huge bear trap or further downside?The Nasdaq 100 has recently broken a critical rising trendline that has supported its bullish trajectory for an extended period. This break signifies a potential shift in market sentiment, suggesting that the prior uptrend may be losing steam. When an established trendline is breached, it often signals a change in the market's direction, indicating that buyers are losing control and sellers are starting to assert dominance.
In addition to the trendline break, the Nasdaq 100 has now fallen below all of its key moving averages—namely, the 50-day, 100-day, and 200-day moving averages. These moving averages are widely followed indicators of trend strength, and their loss is typically a bearish sign. When prices drop below these averages, it signals weakening momentum, and it becomes harder for the index to regain upward traction without strong buying pressure.
The weekly timeframe shows a beautiful support level if the bulls fail to reclaim all the key moving averages.
Together, the break of the rising trendline and the loss of key moving averages suggest that the Nasdaq 100 could be entering a phase of increased volatility and downward pressure. Traders should closely monitor the index for potential further declines or a failure to reclaim these key technical levels, as they could signal deeper market corrections.
Thanks for your support.
- Make sure to follow me so you don't miss out on the next analysis!
- Drop a like and leave a comment!

US100 Downtrend Analysis & Key LevelsAfter analysing the US100 chart, the index has been trading within a downtrend channel since Friday, February 21, 2025. After dropping to 19,131, it attempted a recovery but faced strong resistance at 19,957, leading to a decline. As the saying goes, “ Follow the trend—the trend is your friend. ” Given the ongoing downtrend, US100 may continue to decline toward the next strong support level at 18,489.
Ensure you adhere to proper risk management for long-term success.
Happy Trading

NAS100/US100/NQ/NASDAQ Long-Bet Me, Others Sell=I BuyNAS100, US100, NQ, NASDAQ Long for 2 Weeks, it could drop a little forsure because I didn't get bullish confirmation but with my back testing of this strategy, it hits multiple possible take profits atleast TP-1, manage your position accordingly.
Use proper risk management
Looks like good trade.
Lets monitor.
Use proper risk management.
Disclaimer: only idea, not advice

NAS100 OUTLOOKAnalysis of NAS100 (H4 Timeframe)
Key Observations:
Downtrend Structure
The market has been in a consistent downtrend since February 2025.
Lower highs and lower lows indicate strong bearish momentum.
Key Support Zone (Near 19,225)
The price is currently sitting at a critical support level.
If buyers step in, we could see a bounce to previous resistance levels.
If this level breaks, the next potential target could be around 18,800 - 18,700.
No Clear Bullish Signs Yet
The price is still making lower highs.
A bullish reversal would require a strong rejection or bullish candlestick pattern at support.
Possible Trade Setups
Bullish Setup (Buy Trade - If Support Holds)
✅ Entry: If price forms a bullish reversal pattern around 19,225 - 19,300.
🎯 Target: First target 19,800, second target 20,400.
🛑 Stop-Loss: Below 19,100 to avoid fakeouts.
📈 Confirmation: Look for bullish engulfing candles or double-bottom formations.
Bearish Setup (Sell Trade - If Support Breaks)
❌ Entry: Below 19,100 after a strong bearish close.
🎯 Target: First target 18,800, second target 18,600.
🛑 Stop-Loss: Above 19,400 to protect against false breakdowns.
Final Thoughts:
Right now, NAS100 is at a make-or-break level.
If buyers defend support, a rally to 19,800+ is likely.
If support breaks, expect a further drop to 18,800 or lower.
Wait for confirmation before entering a trade.

NDX Nasdaq *2025* Bear MarketCalled it too early. Trump pump is over. Now back on track. See you at $14K.

NASDAQ: Forming the bottom. Don't miss the 2025 rally to 28,000.Nasdaq is bearish on its 1D technical outlook (RSI = 35.342, MACD = -382.320, ADX = 38.919), headed towards oversold territory. 1W is also headed towards an oversold state (RSI = 36.953) as the price has crossed under the 1W MA50 and is approaching the 1W MA100. This is currently waiting at the bottom of the 2 year Channel Up. This 6 month correction is so far technically nothing but the bearish wave of this Channel Up and has been almost as strong (-15.89%) as the previous in July-Aug 2024.
Notice an key technical tendency here, no correction/bearish wave has ever crossed under the S1 level of two highs before. The current S1 is at 18,400. So taking those conditions into consideration as well as the fact that the 1W RSI is at the bottom of its Channel Down, we see this week as the bottom formation candle that will start a new bullish wave. The prior two such waves both made an incredibly symmetric rise of +52.60%, so expecting the same puts our target at TP = 28,000, most likely by December 2025-January 2026.
## If you like our free content follow our profile to get more daily ideas. ##
## Comments and likes are greatly appreciated. ##

NAS100 BuyDonal Trump Announces BIG corporations to increase investment in the US Economy. whilst this suggests loss in profit for the shortrun, theres a potential for high yeilds in the long run. looking forward to seeing how this will translate on the ground. lets trade with caution as this is during a news event and anything drastic could happen.

NASDAQ 55% dip coming? The next two weeks are critical...I haven't posted on here in a minute but the NAS is looking weak, along with the SP and DOW, but mainly the SP and NAS. The next two weeks are critical to the remainder of the year. If we breach the 2024 high and close below it in January, I anticipate more lows. If we breach above it, and can hold above it through mid-February, we're probably looking at another bullish year.
My analysis points to a consolidation with bearish intent on the horizon, with a potential target of 9,800.
The tools I used in this video are liquidity techniques.
This is a macro/yearly analysis.
There is no "setup" I only use yearly outlooks to help me gauge sentiment.
The possible catalyst for us to breach and reverse the 2024 high could be inauguration. The time window to monitor is now through the Super Bowl.
If you want to learn my style of trading I'm opening a group this summer, give me a follow on trading view and I'll reach out to you when it launches.
....
I apologize for any noises in the background, and my explanations being a little scattered, I'm busy but wanted to get this analysis done real quick before it was too late, or I forgot, I've been meaning to post this since early December.

Bear Market FormingVery big things happening in the economy this quarter, mainly trade wars, real wars, and new policies.
Job cuts 100k+ government job cuts, 25-50k more expected in the coming months. In addition to 35k tech layoffs, and 38,956 retail job cut announcement. So probably 225k+ jobs lost this year
The number of people employed part-time for economic reasons increased by 460,000 to 4.9 million in February.
Tarrifs are divided, some calling it inflationary, but statements from JPM: "Roughly half of the GDP decline from higher tariffs is attributed to a negative sentiment shock related to rising trade policy uncertainty." and RBC: "Based on 2024 import data from Canada, Mexico, and China, the announced tariffs could boost total U.S. tariff revenues by about $300 billion" at least show potential offsets.
War has been ongoing, but increased economic activity from Russia, and stimulus in the EU increase liquidity in the markets.
But all of that is going to take time to settle, so you cant write off another 6 months of a downtrend of up to 10% in equities - until we get more information introduced to the market.

How Low Could the Nasdaq Go?The Nasdaq-100 has pulled the broader market lower since late February. What could be next for the tech-heavy index?
The first pattern to consider is the 20,315 level: its post-election pullback low on November 15. NDX slid below that price in early March and rebounded to stall at the same area last week. That could make some chart watchers think old support has become new resistance.
The index also peaked at its 200-day simple moving average (SMA), which may suggest the longer-term trend has grown more bearish. The falling 8- and 21-day exponential moving averages (EMAs) may paint a similar picture in the shorter term.
That combination of patterns, including a lower high at old support, could make traders expect a lower low. The September trough near 18,400 may be a logical place to look.
We’ll next consider two important charts impacting the Nasdaq.
First, Apple NASDAQ:AAPL made a potentially lower high at its falling 21-day EMA. It also stalled at a 50 percent retracement of a recent move. The 50-day SMA may be nearing a “death cross” under the 200-day SMA, as well.
Second, the Philadelphia Semiconductor Index NASDAQ:SOX closed slightly below its previous low from April. Does it face risk of a further breakdown?
If those two charts result in bearish price action, it may additionally keep pressure on NDX.
TradeStation has, for decades, advanced the trading industry, providing access to stocks, options and futures. If you're born to trade, we could be for you. See our Overview for more.
Past performance, whether actual or indicated by historical tests of strategies, is no guarantee of future performance or success. There is a possibility that you may sustain a loss equal to or greater than your entire investment regardless of which asset class you trade (equities, options or futures); therefore, you should not invest or risk money that you cannot afford to lose. Online trading is not suitable for all investors. View the document titled Characteristics and Risks of Standardized Options at www.TradeStation.com . Before trading any asset class, customers must read the relevant risk disclosure statements on www.TradeStation.com . System access and trade placement and execution may be delayed or fail due to market volatility and volume, quote delays, system and software errors, Internet traffic, outages and other factors.
Securities and futures trading is offered to self-directed customers by TradeStation Securities, Inc., a broker-dealer registered with the Securities and Exchange Commission and a futures commission merchant licensed with the Commodity Futures Trading Commission). TradeStation Securities is a member of the Financial Industry Regulatory Authority, the National Futures Association, and a number of exchanges.
TradeStation Securities, Inc. and TradeStation Technologies, Inc. are each wholly owned subsidiaries of TradeStation Group, Inc., both operating, and providing products and services, under the TradeStation brand and trademark. When applying for, or purchasing, accounts, subscriptions, products and services, it is important that you know which company you will be dealing with. Visit www.TradeStation.com for further important information explaining what this means.

NAS100: Likely rebound at major point within Ascending ChannelCAPITALCOM:US100 is likely to be undergoing a corrective move as it tests the lower boundary of the ascending channel, as shown on my chart. This boundary serves as dynamic trendline support and a significant bullish reaction could happen if buyers step in at this level.
A successful rebound from this support could lead to a move toward the midline of the channel, with the next target at around 22,000 . This scenario would maintain the overall bullish trend structure.
However, a clear breakdown below the trendline support would weaken the bullish outlook and could lead to further downside.
Monitoring candlestick patterns and volume at this critical zone is essential for identifying buying opportunities. Proper risk management is advised, always confirm your setups and trade with solid risk management.
If you have any thoughts on this setup or additional insights, drop them in the comments!


Are we sleeping on a massive double top?As you can see, The Nasdaq has made two near equal peaks around the 22100 area.
Although the Weekly candles of the first and second week of February were bullish, it coincided with two weeks of declining volume, usually meaning momentum exhaustion.
On the 18th February the Nasdaq printed a strong ‘no body’ red doji on the daily TF. This is an indecision candle but can signal the beginning of a trend change.
The Green Areas show the Daily Fair Value Gaps and I’ve but a target beside the Fair Value Gaps that are currently unfilled.
If the Nasdaq breaks beneath 20500, the targets underneath this price is where I’d expect price to be drawn towards.
Also, I have highlighted some notable lows where I’d expected volatility around. I am not suggesting at that this move could in a straight line by the way. If it happens, it will happen in waves.
This is based 100% on technical analysis.


Nasdaq short: Wave 5I think that the retracement up as a wave 4 may have completed and thus I am calling for a short for a wave 5. Place your stop above wave 4 high.

NSDQ100 INTRADAY ahead of tariff announcement Donald Trump’s team is finalizing options for a reciprocal tariff plan, with proposals including a tiered system and a customized approach. Markets await clarity from the president’s 4 p.m. Rose Garden announcement, which could impact trade and financial markets.
Resistance Level 1: 19579
Resistance Level 2: 19962
Resistance Level 3: 20345
Support Level 1: 19077
Support Level 2: 18815
Support Level 3: 18434
This communication is for informational purposes only and should not be viewed as any form of recommendation as to a particular course of action or as investment advice. It is not intended as an offer or solicitation for the purchase or sale of any financial instrument or as an official confirmation of any transaction. Opinions, estimates and assumptions expressed herein are made as of the date of this communication and are subject to change without notice. This communication has been prepared based upon information, including market prices, data and other information, believed to be reliable; however, Trade Nation does not warrant its completeness or accuracy. All market prices and market data contained in or attached to this communication are indicative and subject to change without notice.

Hanzo | Nas100 15 min Breaks – Will Confirm the Next Move🆚 NAS100
The Path of Precision – Hanzo’s Market Strike
🔥 Key Levels & Breakout Strategy – 15M TF
🔥 Deep market insight – no random moves, only calculated execution.
☄️ Bullish Break Out Setup – 19490 Zone
Price must break liquidity with high volume to confirm the move.
☄️ Bearih Break out Setup – 19350 Zone
Price must break liquidity with high volume to confirm the move.
🩸 15M Time Frame Confluence
————
CHoCH & Liquidity Grab @ 19100
Key Level / Equal Highs Formation
Strong Rejection from 18800 – The Ultimate Pivot
🔥 1H Time Frame Confirmation
Twin Wicks @ 19120 – Liquidity Engineered
BOS @ 19030 – Directional Shift Confirmed
☄️ 4H Historical Market Memory
——
💯 29 Aug 2024 – First Retest @ 19150
💯 5 Sep 2024 – Second Retest @ 19100
💯 12 Sep 2024 – Third Retest @ 19200
👌 The Market Has Spoken – Are You Ready to Strike?
Hanzo | Nas100 15 min Breaks – Will Confirm the Next Move

US100 analysis Hi traders as you can see we've been trading in strong uptrend channel however I call it big bearish flag and it is broken as a buyer do you goo against it expecting market to just reject n continue to goo up noo,if am not willing to follow the trend I wait n monitor trade to my demand zones,expect more drops to come as trump raise another tarrif on 2 April my target is at 168 highs n understand that I don't control the market but I follow the trends n my rules, trading with wars it's very surprising n aggressive I can say that 2025 soo far it's hard to position yourselfs in long term gains as it's under pressure since January soo it might be a good year or bad year take care.

Hanzo | Nas100 15 min Breaks – Will Confirm the Next Move🆚 NAS100
The Path of Precision – Hanzo’s Market Strike
🔥 Key Levels & Breakout Strategy – 15M TF
🔥 Deep market insight – no random moves, only calculated execution.
☄️ Bullish Setup – 19170 Zone
Price must break liquidity with high volume to confirm the move.
🩸 15M Time Frame Confluence
————
CHoCH & Liquidity Grab @ 19100
Key Level / Equal Highs Formation
Strong Rejection from 18800 – The Ultimate Pivot
🔥 1H Time Frame Confirmation
Twin Wicks @ 19120 – Liquidity Engineered
BOS @ 19030 – Directional Shift Confirmed
☄️ 4H Historical Market Memory
——
💯 29 Aug 2024 – First Retest @ 19150
💯 5 Sep 2024 – Second Retest @ 19100
💯 12 Sep 2024 – Third Retest @ 19200
👌 The Market Has Spoken – Are You Ready to Strike?

NAS Falling Knife is OverNAS Falling Knife is Over.
It has been taking support from its trend support.
An uptrend may start from here.
