NAS100 NASDAQThis is the current chart that we are facing on the nas100, I am not having any extended sells on sight because of the PD Arrays that are on the daily chart, according to how I see it, there might be a bearish retracement to push higher to the daily gap and zones. Happy Trading
USTEC trade ideas

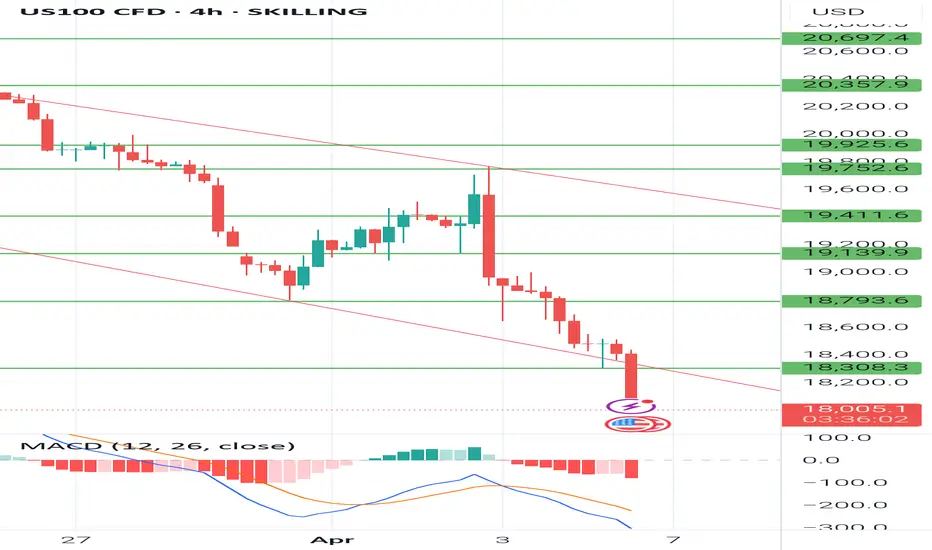
US100Strong weekly support zone got broken and now a possible retest is being made. If price gets back to zone of 18,300 - 18,500 and bearish signals are given then we shall be going back down to support of 16,500.

NAS100 - Monthly Demand Zone Rejection | Massive Bullish PotentThe NAS100 has pulled back significantly from its all-time highs, retracing into a major monthly demand zone aligned with the 50% Fibonacci retracement level (16,344.76).
🔍 Key Technical Highlights:
Demand Zone: Price has tapped into a historically strong demand block between 14,955 – 16,344 (gray box), which previously acted as a launchpad for the last rally.
Fibonacci Levels: Price bounced right off the 50% Fib level, showing early signs of bullish interest. Below lies the 61.8% and deeper retracement levels at 14,955 and 13,872 respectively—strong areas to watch if price dips further.
Bullish Reversal Candlestick: Current monthly candle showing potential reversal with high buying pressure.
RSI: The RSI is rebounding from near the 40 level, historically acting as support during major bull runs.
🎯 Trade Idea:
Entry: Near current levels or on a retest of 16,344
Target: 25,410 (Previous ATH and Fibonacci extension zone, +27%)
Stop Loss: Below 14,000 support, giving room for volatility
🧠 RSTRADING View:
We’re anticipating a long-term bullish reversal as the market finds footing at a key institutional zone. With macroeconomic optimism returning and tech stocks regaining momentum, NAS100 could be setting up for a new leg higher.

NAS100 Rebounds Sharply from Demand Zone – More Upside Ahead?The NASDAQ 100 (NAS100) just delivered a textbook bounce from the key demand zone between 16,800 and 16,900, showing signs of a strong bullish reaction after a sharp drop.
This reaction may be the start of a potential bullish reversal, especially with upcoming US news that could add fuel to the move.
Key Levels:
Demand Zone (Support): 16,800 - 16,900
This zone has held firm and triggered a rapid bullish engulfing move – clear buyer interest!
Next Resistance Levels:
18,437 (Mid-range target – strong historical resistance)
19,852 (Supply zone – high confluence area with potential to reject price)
Bullish Bias Reasoning:
Strong bullish momentum post-dip
Buyers defended key structure near 16,826
Clean structure for risk-reward trades
Possible double bottom forming on lower timeframes
Possible Trade Setup (Not Financial Advice):
Entry: 17,000 – 17,100
SL: Below 16,750
TP1: 18,437
TP2: 19,850
Watchlist Alert:
US economic data incoming – high-impact news could create volatility and push NAS100 into breakout territory.
---
Are you buying the NASDAQ dip or waiting for confirmation? Comment your outlook below!


NASDAQ - Bounce here could mean strength.The chart is self - explanatory as always.
Nasdaq is sitting at a critical zone — the previous all-time high area — with the 200-week EMA just below.
📊 From a technical standpoint, a bounce here would signal potential strength.
⚠️ But when panic sets in, technicals can take a back seat.
Stay sharp. Manage risk.
Disclaimer: This analysis is purely for educational purposes and does not constitute trading advice. I am not a SEBI-registered advisor, and trading involves significant risk. Please consult with a financial advisor before making any investment decisions.

US100 looking for saleslooking at the strong trend to the down site we keep an eye on key entry points to ride with the trend

What Happens Elliott Wave Sequence Completes?Just a quick chart on Nasdaq to show what happens when the Elliott Wave count is completed?
Usually you'd see a major correction. The choice of word depends on the chart time frame. On a monthly chart its still a correction, obviously that is not true for a daily chart where it looks like a SPIKE down.
This chart shows, Wave 5 is terminating within Target zone.

#Nasdaq analysis for the months or years ahead.I hope the price moves in line with this perspective and forms a new high in the future. And on the other hand, it strengthens your viewpoint and enables you to become one of the future millionaires of the stock market:))

Bearish MovementThere is a huge dragon fly doji currently,but if price moves to 16927.4 and fails to break through that price zone,it will continue downwards until 14121.6

NAS100 vs Russell2000 ShortNAS100 vs Russell2000 is now net short on the regression break.
This is just for market measurements purposes

Potential Bearish SetupThe chart indicates that the US100 index has broken below a strong ascending trendline, signaling a possible shift from bullish to bearish momentum.
📊 Trade Idea:
Entry: On a pullback to the 18,300–18,350 zone (look for bearish confirmation like a reversal candlestick).
Target: 15,500–16,000 area
Stop-loss: Above 18,350 (above the resistance/pullback zone)
Risk/Reward: Favorable setup if confirmed
This setup is based on classic price action: trendline break + pullback + continuation.

NDX multiple channels, Which one is correct?Channels can be drawn in many ways because of fractal nature of markets. Every one could draw different channels and they all could be valid, So I prefer to draw a few likely ones some short term and others long term and find a cluster of convergence for high probability. No one is perfect
So just presenting what I see in NDX, mot likely ones
I expect Vix to reach 70, levels reached in 2008-GFC and 2020-covid. The tariff is a significant event in American history

NASDAQ Bearish, What's Next?Price respected Weekly's bearish imbalance to continue lower. Still price is within the weekly's context area to which is suitable to look for entries in lower timeframes targeting weekly's swing low (POI).
Once, the Weekly POI get's tagged we might look to continue to the next POI (Point of Interest). Likely, the daily swing lows.
What's Next?
Pontetial target price is 18,537.88.


'02 & '08 vibes is here for NasdaqI think Nasdaq is heading to MA200. We're about to experience '02 / '08 vibes again?

Short Position - NASDAQShort Position Entry: Consider initiating a short position if the Nasdaq-100 Index falls below 21,000.
Stop Loss (SL): Set a stop loss at 21,555 to manage potential losses.'
Market Sentiment: The combination of the Federal Reserve's cautious approach and rising inflation may contribute to a weakening market sentiment, potentially leading to a downward movement in the index.
his recommendation is for educational purposes only. Always consult your financial advisor before making any investment decisions. Stock trading involves risks, including the potential loss of capital. Ensure to evaluate your risk tolerance and conduct thorough research.

NASDAQ CRASH: Are We in a Bear Market? Let’s Break it Down!The NASDAQ 100 (NDX) just took a huge dive, dropping 21.69% from its recent highs. That officially meets the definition of a bear market (a decline of 20% or more). The question is: Are we going lower, or is a reversal coming? Let’s analyze the moving averages, Fibonacci levels, and key market signals to figure out what’s next.
📊 Moving Averages Breakdown: A Bearish Trend Confirmation?
One of the biggest red flags here is how the price is behaving relative to its moving averages:
🔴 Short-Term Moving Averages (Yellow & Green - 9 EMA & 21 EMA)
These are the fastest-moving indicators and help us track momentum.
The price has been consistently closing below them, showing strong bearish pressure.
Whenever the price tries to bounce, it gets rejected at these levels, signaling weak demand.
🟠 Mid-Term Moving Averages (Orange - 50 MA)
The 50-day moving average acts as a key support/resistance zone in many market trends.
In this chart, we saw a breakdown below the 50 MA, and since then, the price hasn’t even attempted to reclaim it.
This suggests that even mid-term traders are losing confidence, leading to further selling pressure.
🔵 Long-Term Moving Averages (Blue - 200 MA)
The 200-day moving average is a critical level for defining long-term trends.
Right now, the index is trading well below the 200 MA, which signals a major trend shift—we're no longer in a bull market.
The further we move away from this level, the harder it becomes for bulls to regain control.
➡️ Conclusion: All key moving averages are trending downward, and the price is failing to reclaim even short-term levels. This means we are likely in a sustained bear market unless we see a major reversal.
Key Fibonacci Levels & Market Structure
We are currently testing the 1.618 Fibonacci extension at 17,268. If this level fails, we could see further downside towards 15,771 (2.618 Fib) or even lower.
Any bounce will face major resistance at 18,500 - 19,100, where multiple Fib retracements and moving averages converge.
🔥 What’s Next?
If buyers step in at 17,268, we might see a relief rally.
If we break below it, expect 15,771 or even 14,273 to be the next downside targets.
Watch the moving averages closely if we start reclaiming the 9 & 21 EMA, that could be an early sign of a recovery.
Are we heading deeper into a bear market, or is this just a big correction before another bull run? Drop your thoughts below!

NAS100/US100/NQ/NASDAQ Long NAS100, US100, NQ, NASDAQ Long, with my back testing of this strategy, it hits multiple possible take profits atleast TP-1, manage your position accordingly.
Use proper risk management
Looks like good trade.
Lets monitor.
Use proper risk management.
Disclaimer: only idea, not advice


BUY NASDAQBeen a while since I last posted about the American market, you can buy and target the same level as mine.
Follow for more!

Nasdaq chart 4april 2025Based on 4h frame it's on the lower edge of down trend. So it have a little chance to move up for few hours but knowing that today have 2 major events NFP and fed chairperson speak so it's better to avoid this day or at least wait till these events ends.
Nasdaq market analysis: 04-APRIL-2025Good morning. Welcome to today's Nasdaq market analysis and educational insights for price action traders.
