WTI trade ideas

USOIL Strategy DiscussionThis week, we've analyzed the reasons behind the short - term strong performance of crude oil. We specifically remind you to pay attention to the price movements within the range of $68.5 - $69.5.
Once again, we advise you to observe more and trade less.
We share various trading signals every day with over 90% accuracy
Fans who follow us can get high rewards every day
If you want stable income,You can follow the link below this article

WTI CRUDE OIL: Last pull to 4H MA50 possible, $72 target remainsWTI Crude Oil just turned bullish on its 1D technical outlook (RSI = 55.181, MACD = -0.570, ADX = 39.438) as it crossed above the 4H MA200. It is still under the 1D MA50, so the newly emerged Channel Up may pull the price back under the 4H MA50 one last time before the next, even stronger bullish wave. Overall, we remain long (TP = 72.00), even more so on the long term.
## If you like our free content follow our profile to get more daily ideas. ##
## Comments and likes are greatly appreciated. ##

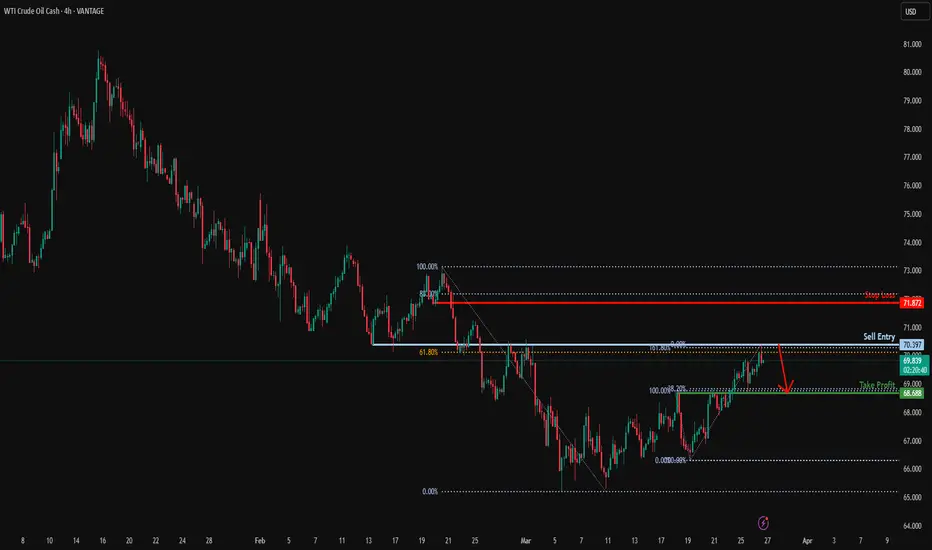
Potential bearish drop?USO/USD is reacting off the resitance level whic is an overlap resistance level that line sup with the 161.8% Fibonacci extension and the 61.8% Fibonacci retracement and could drop from this level to our take profit.
Entry: 70.39
Why we like it:
There is an overlap resistance level that lines up with the 161.8% Fibonacci extension and the 61.8% Fibonacci retracement.
Stop loss: 71.87
Why we like it:
There is a pullback resistance level that is slightly below the 88% Fibonacci retracement.
Take profit: 68.68
Why we like it:
There is an overlap support level that lines up with the 38.2% Fibonacci retracement.
Enjoying your TradingView experience? Review us!
Please be advised that the information presented on TradingView is provided to Vantage (‘Vantage Global Limited’, ‘we’) by a third-party provider (‘Everest Fortune Group’). Please be reminded that you are solely responsible for the trading decisions on your account. There is a very high degree of risk involved in trading. Any information and/or content is intended entirely for research, educational and informational purposes only and does not constitute investment or consultation advice or investment strategy. The information is not tailored to the investment needs of any specific person and therefore does not involve a consideration of any of the investment objectives, financial situation or needs of any viewer that may receive it. Kindly also note that past performance is not a reliable indicator of future results. Actual results may differ materially from those anticipated in forward-looking or past performance statements. We assume no liability as to the accuracy or completeness of any of the information and/or content provided herein and the Company cannot be held responsible for any omission, mistake nor for any loss or damage including without limitation to any loss of profit which may arise from reliance on any information supplied by Everest Fortune Group.
USOil Sell 70.000Crude oil has been fluctuating and rising recently, reaching a three-week high. From a fundamental perspective:
Supply: The United States has intensified its energy sanctions against Iran. Attacks on Saudi facilities have affected their performance. The OPEC+ will gradually lift the voluntary production cuts starting from April and may increase production for the second time in May. The 30-day ceasefire agreement between Russia and Ukraine has not been effectively implemented in substance. However, recently, the United States, Russia, and Ukraine have reached some consensus on Black Sea navigation and the protection of energy facilities.
Inventory: According to API data, for the week ending March 25, U.S. crude oil inventories dropped significantly by nearly 9 million barrels. However, commercial crude oil inventories have been increasing continuously for several weeks, and the overall inventory remains at a high level.
Geopolitics: The U.S. airstrikes against the Houthi armed group in Yemen and Israel's military operations in the Gaza Strip have heightened concerns about the disruption of crude oil supplies in the Middle East. The United States' continuous strengthening of sanctions against Iran and Venezuela also includes a plan to impose a 25% tariff on countries importing Venezuelan crude oil.
Production Increase Pressure: The daily supply increments of non-OPEC countries (such as the United States and Brazil) far exceed the global demand growth rate, which has long-term downward pressure on the oil price center.
💎💎💎 USOIL 💎💎💎
🎁 Sell@70.000 - 70.200
🎁 TP 68.5 68.0 67.5
The market has been extremely volatile lately. If you can't figure out the market's direction, you'll only be a cash dispenser for others. If you also want to succeed,Follow the link below to get my daily strategy updates

US OIL SHORT & LONG TRADESAs I stated yesterday after price rejected from the Diagnonal resistance, I said price could retest and dump further or breakout to higher levels.
I did ioen a short for the dump, but then I checked the trade this morning and realized it's in a breakout trend.
So I closed the short in a small los and capitalized on the long at the point of resting the Trendline which is still running.
Let's see how high price can climb now, currently at a strong zone.

USOIL:It's time to go shortRecently, the WTI crude oil has been on a continuous upward trend with fluctuations. The current intraday price has reached a three - week high. At present, the long - position sentiment in the market is greatly influenced by the fundamental news, mainly due to the intensified U.S. sanctions on Iranian energy and the ineffective implementation of the 30 - day cease - fire agreement between Russia and Ukraine.
Today's trading strategy: Focus on shorting at high levels. Currently, the price has a firm support at $69. Observe whether it can reach the resistance range of $69.5 again. If it breaks through the upper level, look at the important psychological resistance level of $70. Select to short again within the range.
USOIL Trading Strategy:
Sell@69.5-70
TP:68-67
Get daily trading signals that ensure continuous profits! With an astonishing 90% accuracy rate, I'm the record - holder of an 800% monthly return. Click the link below the article to obtain accurate signals now!

Oil Surges Toward Four-Week Highs on U.S. Inventory DropOil extended gains and approached four-week highs, supported by an unexpected decline in U.S. crude inventories and persistent geopolitical tensions that keep international markets on edge.
The price of WTI has once again surpassed $70 per barrel, its highest level in nearly a month. This bullish move is mainly driven by a 3.3 million barrel drop in U.S. commercial inventories, a figure that doubles analysts' initial expectations of only a 1.6 million barrel reduction.
This significant inventory drawdown, reported by the latest release from the Energy Information Administration (EIA), reflects a robust domestic demand, largely fueled by increased activity at U.S. refineries. Over the past week, these facilities boosted their daily processing to an average of 15.8 million barrels, reaching a utilization rate of 87%, a considerable rise from the previous period.
Similarly, there was a further decline in key refined product stocks: gasoline fell by 1.4 million barrels, while distillates dropped by 0.4 million barrels. These reductions suggest a healthy recovery in fuel consumption, though differences remain compared to historical averages: gasoline inventories are still 2% above the five-year average, while distillates remain a concerning 7% below.
For oil-exporting countries like Mexico and Colombia, this situation presents a significant opportunity. Although average U.S. crude imports remain 11% below the same period last year, a sustained recovery could positively boost the economic outlook of these nations, offering key revenue amid a globally uncertain economic context.
However, geopolitics remains a key player in the evolution of the oil market. The U.S. threat to impose 25% tariffs on Venezuelan crude imports has added pressure on the trade flow to China, the main buyer of Venezuelan oil. At the same time, new sanctions on Iran could further tighten global supply, once again placing Saudi Arabia in a position to cover any supply shortfall.
Moreover, recent agreements between the U.S., Ukraine, and Russia to reduce attacks on energy infrastructure suggest an effort to partially stabilize the market; however, any breakdown in these negotiations could quickly reintroduce volatility in oil prices.
Overall, while economic risks from trade tensions persist, the current balance between strong U.S. demand and supply constraints due to geopolitical factors is creating a bullish environment for oil. The energy market continues to show clear signs of strengthening, suggesting that prices could remain firm in the short term, with close monitoring of any unexpected shifts in the global landscape.
Pepperstone doesn’t represent that the material provided here is accurate, current or complete, and therefore shouldn’t be relied upon as such. The information, whether from a third party or not, isn’t to be considered as a recommendation; or an offer to buy or sell; or the solicitation of an offer to buy or sell any security, financial product or instrument; or to participate in any particular trading strategy. It does not take into account readers’ financial situation or investment objectives. We advise any readers of this content to seek their own advice. Without the approval of Pepperstone, reproduction or redistribution of this information isn’t permitted.

USOIL - NEW BREAKOUTHello Traders !
The USOIL price broke the resistance level (68.427 - 68.703).
This key level becomes new support !
So, I expect a bullish move🚀
_______________
TARGET: 70.080🎯

WTI crude oil Wave Analysis – 26 March 2025
- WTI crude oil broke resistance area
- Likely to rise to resistance level 71.00
WTI crude oil recently broke the resistance area between the resistance level 68.60 (top of the previous wave 1), resistance trendline of the daily down channel from February and the 50% Fibonacci correction of the downward impulse from last month.
The breakout of this resistance area accelerated the active impulse wave 3 of the higher impulse wave (3).
WTI crude oil can be expected to rise to the next resistance level 71.00, target price for the completion of the active impulse wave 3.

USOIL SHORT FROM RESISTANCE|
✅CRUDE OIL has hit a TP
Of our last free signal and
Went further up just as we
Predicted but will soon hit
A horizontal resistance level
Of 70.57$ from where we will
Be expecting a local bearish
Correction and a move down
SHORT🔥
✅Like and subscribe to never miss a new idea!✅
Disclosure: I am part of Trade Nation's Influencer program and receive a monthly fee for using their TradingView charts in my analysis.

USOIL Criteria for this trade
1. 3 days close above trend line
2. break out of 50 EMA
3. a Friday close above trend line

WTI Crude INTRADAY oversold bounce back on maritime ceasefireThe WTI Crude Oil price action remains bearish, aligning with the prevailing downtrend. The current movement suggests an oversold bounce, but the broader outlook remains weak unless a significant breakout occurs.
Key Levels to Watch:
Resistance Levels: 70.50 (critical level), 71.30, 72.11
Support Levels: 67.95, 67.00, 65.40
Bearish Scenario:
A rejection from the 70.50 resistance level could reaffirm the downside bias, leading to a continuation of the bearish move toward 67.95, with further downside targets at 67.00 and 65.40 over the longer timeframe.
Bullish Scenario:
A breakout above 70.50 with a daily close above this level would challenge the bearish sentiment, paving the way for further gains toward 71.30, followed by 72.11.
Conclusion:
The market sentiment remains bearish, with the 70.50 level acting as a crucial resistance zone. A rejection at this level could reinforce the downside trend, while a confirmed breakout would shift the outlook to bullish, favoring a potential rally. Traders should watch price action at this key level for further confirmation.
This communication is for informational purposes only and should not be viewed as any form of recommendation as to a particular course of action or as investment advice. It is not intended as an offer or solicitation for the purchase or sale of any financial instrument or as an official confirmation of any transaction. Opinions, estimates and assumptions expressed herein are made as of the date of this communication and are subject to change without notice. This communication has been prepared based upon information, including market prices, data and other information, believed to be reliable; however, Trade Nation does not warrant its completeness or accuracy. All market prices and market data contained in or attached to this communication are indicative and subject to change without notice.

Crude Oil Signal UpdateI have been telling all of you. Some might ignore my signal just because i dont have much followers or boosts, but I proved myself over time.
Its your choice to follow the signal or not.
If you have already invested at least 50k without leverage, you would already be in a profit of 2.5k usd.
For the followers, our first TP is 72(+5~7$ per barrel if you started buying from the signal ive sent). We have 3 more TPs.
Suit yourselves 👍
CFD on WTI CRUDEOIL (US OIL)ITS A T4HR TRADE FOR USOIL
1. Got Activated.
2. Stop loss @ 69.65 and resp. Target 1 @ 69.65 and Target 2 @ 67.59
3. Its a swing trade for 1 week trade working days duration.
4. Kindly make your orders accordingly to the duration period mentioned.
God bless. Happy trading Days

USOIL and The Elliott Wave Updates. The structure seen is a 5 Wave move and is part of a B(3 Wave structure) of a Flat marked in Black. In this 5 Wave move marked in Red we can see that Wave 2 was a Zigzag, meaning our Wave 4 would be a Flat. Wave 3 hits the 161.8% mark and moves back to form an A of the Flat marked in Green. B must be a 3 Wave move and must move beyond the ending of 3(Red). When this occurs, a Wave C is formed(Green) and hence Wave 4(Red). What is left is a final Wave, a 5, to complete the first impulse of B(Black). Upon completion there must be a corrective structure to separate the impulse that just ended and Wave B's final impulse. Marked in Blue, is Wave A that just ended, a Wave B that we can expect to be against the trend and a final one that will begin soon after. Note, Wave B(Blue) MUST be a 3-Wave move.

Oil and EMA 200 4hThe oil price is testing the EMA 200 moving average zone. $70.00 could be a big hurdle, from where we would start a new pullback. Conversely, rising tensions in the Middle East are supporting oil prices. Based on that we can hope for a bounce above $72.00.
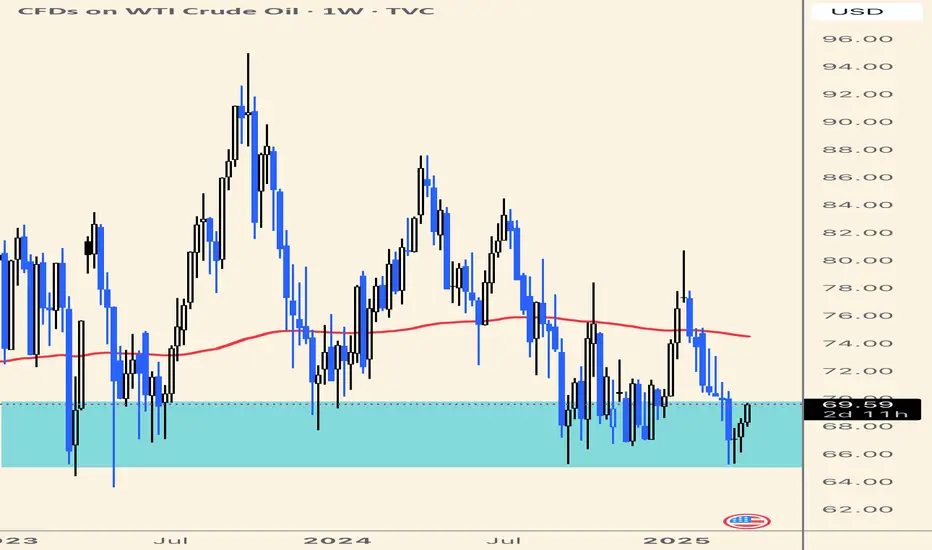
“WTI Poised for a Renewed Upswing?”On the weekly timeframe, USOIL (WTI) is currently estimated to be in the early stages of wave Y of wave (B). This suggests that USOIL still has the potential to strengthen further, targeting the 72.66–79.14 area.

USOIL SELLERS WILL DOMINATE THE MARKET|SHORT
USOIL SIGNAL
Trade Direction: short
Entry Level: 69.08
Target Level: 67.53
Stop Loss: 70.11
RISK PROFILE
Risk level: medium
Suggested risk: 1%
Timeframe: 9h
Disclosure: I am part of Trade Nation's Influencer program and receive a monthly fee for using their TradingView charts in my analysis.
✅LIKE AND COMMENT MY IDEAS✅

Hellena | Oil (4H): SHORT to the area of 65.268.Colleagues, I believe that the downward movement is not over yet, and now the price is in a complex combined correction. The second correction also consists of “ABC” waves.
In an ideal scenario, the price completes wave “C” in the 70.000 area and starts the downward movement to the support area of 65.268.
In general, the plan has not changed since the last forecast, but the bulls still have strength, so we should take the upward movement as an opportunity to profitably go short.
Manage your capital correctly and competently! Only enter trades based on reliable patterns!

Long Entry – Technical & Fundamental Breakdown Technical Rationale:
I’ve taken a long position following a liquidity grab during last night’s session. Price is still respecting the broader bullish structure, and the move down to $68.77 appeared to be a stop run, faking out breakout shorts. My next target is the weekly level around $70.50, assuming no major market shocks through the rest of the week.
Fundamental Rationale:
I remain unconvinced by the current peace talks between Russia and Ukraine, this is likely a slow-moving narrative, and the market seems to be discounting it for now. Supply constraints are still in play, particularly after the new U.S. tariffs on Venezuelan oil. Yesterday’s larger-than-expected API crude draw is also supporting prices. Meanwhile, ongoing conflict between Israel and Iranian proxies continues to disrupt Red Sea shipping, adding further pressure to global supply.
COT Data Summary:
Overall decline in positioning signals caution, not outright bullishness.
Managed Money added to shorts a slight bearish tilt.
Institutional positioning (Other Reportables) shows a mild bullish bias.
The market appears to be watching key support levels and waiting on further fundamental catalysts.

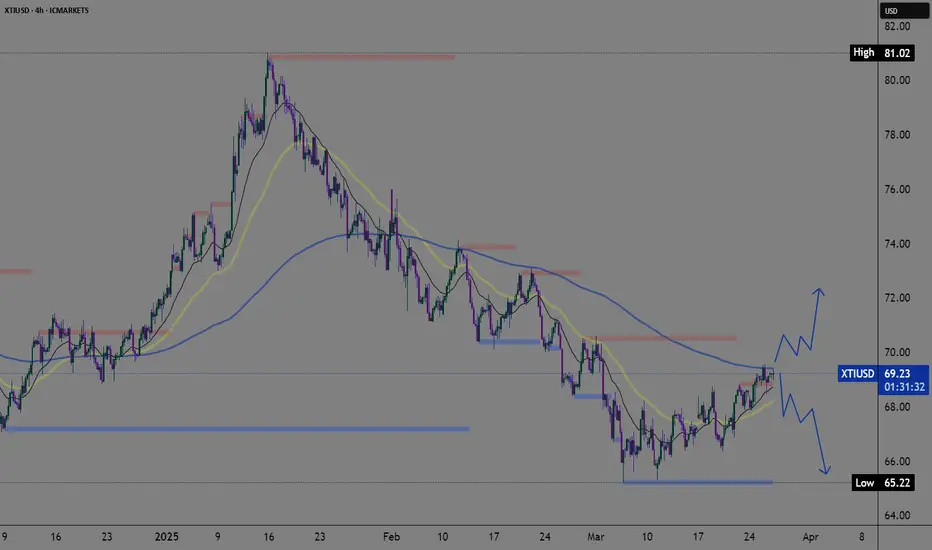
Bullish bounce?WTI Oil (XTI/USD) is falling towards the pivot and could bounce to the overlap resistance level.
Pivot: 68.47
1st Support: 67.43
1st Resistance: 70.38
Risk Warning:
Trading Forex and CFDs carries a high level of risk to your capital and you should only trade with money you can afford to lose. Trading Forex and CFDs may not be suitable for all investors, so please ensure that you fully understand the risks involved and seek independent advice if necessary.
Disclaimer:
The above opinions given constitute general market commentary, and do not constitute the opinion or advice of IC Markets or any form of personal or investment advice.
Any opinions, news, research, analyses, prices, other information, or links to third-party sites contained on this website are provided on an "as-is" basis, are intended only to be informative, is not an advice nor a recommendation, nor research, or a record of our trading prices, or an offer of, or solicitation for a transaction in any financial instrument and thus should not be treated as such. The information provided does not involve any specific investment objectives, financial situation and needs of any specific person who may receive it. Please be aware, that past performance is not a reliable indicator of future performance and/or results. Past Performance or Forward-looking scenarios based upon the reasonable beliefs of the third-party provider are not a guarantee of future performance. Actual results may differ materially from those anticipated in forward-looking or past performance statements. IC Markets makes no representation or warranty and assumes no liability as to the accuracy or completeness of the information provided, nor any loss arising from any investment based on a recommendation, forecast or any information supplied by any third-party.

USOil:When to short at high levels?During the evening session yesterday, the price of crude oil surged again, reaching the resistance level of 69.5 per barrel in the session. However, after encountering resistance, part of the bullish momentum took profits and fled the market, causing the price to decline slightly to the support level of 69 per barrel without further drops.
After today's opening, the bullish momentum is obviously insufficient, and the price has not risen further, showing a downward extension trend.
Today's trading strategy: Focus on taking short positions at relatively high levels. Currently, the support at 69 per barrel is relatively solid. Observe whether the price can reach the resistance range of 69.5 per barrel again. If it breaks through upwards, look at the important psychological resistance level of 70 per barrel. Choose to take short positions again within the range of 69.5 - 70 per barrel, with the target price at $68 per barrel. Participate with a small position.
USOIL Trading Strategy:
Sell@68.5-69
TP:68-67
Get daily trading signals that ensure continuous profits! With an astonishing 90% accuracy rate, I'm the record - holder of an 800% monthly return. Click the link below the article to obtain accurate signals now!
