WTI - Will oil return to the upward trajectory?!WTI oil is located between EMA200 and EMA50 on the 4-hour timeframe and is moving in its medium-term descending channel. In case of a downward correction towards the support area, the next opportunity to buy oil with a reward at a reasonable risk will be provided to us. A valid break of the drawn downtrend line will pave the way for oil to reach the drawn areas.
Goldman Sachs has stated that even if hostilities in Ukraine cease and sanctions are eased, Russia’s oil exports are unlikely to see a significant increase. The bank believes that Russia’s crude oil production will remain capped at 9 million barrels per day, not primarily due to sanctions, but rather because of the country’s commitments under the OPEC+ agreement.
OPEC+, which is responsible for nearly half of the world’s oil production, has decided to delay its planned production increase, which was originally scheduled between April and July. Meanwhile, Trump has announced that additional negotiations with Russia are set to take place in an effort to bring an end to the war in Ukraine—an event that could impact the outlook of global energy markets.
Russia remains one of the key oil suppliers worldwide and plays a significant role in price fluctuations. Goldman Sachs predicts that the price of Brent crude will rise to $79 per barrel by the end of this month, while it is currently trading at around $76 per barrel.
Ukrainian President Volodymyr Zelensky stated that the United States has, in some ways, helped Vladimir Putin break out of his isolation. He emphasized that Trump’s team must gain a better understanding of Ukraine’s actual situation and made it clear that he has no intention of “selling” his country. Zelensky also highlighted the strength and resilience of the Ukrainian military and added that Trump’s envoy should ask ordinary Ukrainians how they perceive him following his recent statements.
Meanwhile, Vladimir Putin announced that the rapid reconstruction of the Caspian Pipeline is not feasible. He explained that Western-made equipment used in the Caspian Pipeline Consortium has sustained severe damage due to recent attacks.
Putin emphasized that the restoration of this pipeline would not be completed swiftly, as critical components rely on Western technology and have been significantly impaired.
The pipeline, which transports Kazakh oil to global markets, has experienced a 30-40% reduction in oil flow following a drone attack on one of its pumping stations in southern Russia. This reduction equates to approximately 380,000 barrels per day (bpd). This development was not entirely unexpected, as Russian Deputy Prime Minister Alexander Novak had previously stated that repairs to the pipeline could take several months.
WTI trade ideas

WTI Crude Oil: Range-Bound Between Critical LevelsLooking at the H1 timeframe for WTI Crude Oil, we're observing a defined range structure:
Market Structure:
Trading within established range (70.17-73.18)
Recent rejection from 72.50 resistance
Moving averages clustered around current price
Multiple tests of both range boundaries
Key Levels:
Upper Range: 73.178
Current Price: ~72.23
Lower Range: 70.168
Immediate Support: 71.81
Technical Indicators:
Volume showing decreased activity in recent consolidation
Momentum indicators in neutral territory
Price oscillating between moving averages
No clear directional bias in indicators
Trading Considerations:
Respect range boundaries for entries
Watch for breakout confirmation with volume
Key resistance at 73.17 needs clear break for upside
Support at 70.17 crucial for maintaining range
BIAS: NEUTRAL
Clear range-bound conditions
No dominant trend direction
Price centered in trading range
Waiting for range breakout for directional bias

Us oil for buy Price was ranging, it broke out and retested the zone with a touch of double bottom and the retest of the neckline.

Bearish drop?WTI Oil (XTI/USD) has rejected off the pivot and could drop to the pullback support that aligns with the 61.8% Fibonacci projection.
Pivot: 72.97
1st Support: 70.37
1st Resistance: 74.21
Risk Warning:
Trading Forex and CFDs carries a high level of risk to your capital and you should only trade with money you can afford to lose. Trading Forex and CFDs may not be suitable for all investors, so please ensure that you fully understand the risks involved and seek independent advice if necessary.
Disclaimer:
The above opinions given constitute general market commentary, and do not constitute the opinion or advice of IC Markets or any form of personal or investment advice.
Any opinions, news, research, analyses, prices, other information, or links to third-party sites contained on this website are provided on an "as-is" basis, are intended only to be informative, is not an advice nor a recommendation, nor research, or a record of our trading prices, or an offer of, or solicitation for a transaction in any financial instrument and thus should not be treated as such. The information provided does not involve any specific investment objectives, financial situation and needs of any specific person who may receive it. Please be aware, that past performance is not a reliable indicator of future performance and/or results. Past Performance or Forward-looking scenarios based upon the reasonable beliefs of the third-party provider are not a guarantee of future performance. Actual results may differ materially from those anticipated in forward-looking or past performance statements. IC Markets makes no representation or warranty and assumes no liability as to the accuracy or completeness of the information provided, nor any loss arising from any investment based on a recommendation, forecast or any information supplied by any third-party.

SELL OIL (WTI) - entry criteria explained!!!!Trader Tom, a technical analyst with over 16 years’ experience, explains his trade idea using price action and a top down approach. This is one of many trades so if you would like to see more then please follow us and hit the boost button.
We are proud to be an OFFICIAL Trading View partner so please support the channel by using the link below and unleash the power of trading view today!
www.tradingview.com

Black GoldFor oil producing countries, the oil charts ain't looking good either, although price has been in a range since 2023 till date, however if price breaks the $66/barrel mark and holds... we coming to $53/barrel
Hopefully this doesn't go as the chart says... this can affect a full economy 🤔, let's see

WTI OIL - USOUSDShort-term outlook:
Downward trend: Right now, there are signs that oil prices could drop, mainly due to weaker global demand and potential overproduction of oil. Citi predicts that without deeper OPEC+ production cuts, prices could fall to $60 per barrel by the end of 2025.
Upward trend: However, OPEC+ might take action to reduce production if prices continue to fall, aiming to keep prices higher, as they’ve done in the past. Also, geopolitical factors could cause temporary price spikes.
Bottom line: There's no strong signal that prices will rise consistently in the short term, but a rebound is possible if geopolitical events or OPEC+ decisions push the market up. However, the trend seems more likely to be downward for the next few weeks.

USOIL - high placed? whats next??#USOIL... market just placed a high and if market hold it in that case we can see a drop from here.
don't be lazy here guys.
stay sharp
good luck
trade wisely

US OIL BULLISH 73Hey there on 1HTF US oil change there ways we now can see at this level we should see a bullish continue will reach next ath record 73 and 73.50
But if the price decline and comes downside and then we should see next support level is
Of US oil from 72 and 71.50 must be bullish candle to our next target 73 and 73.50

USOIL is changing as I analyzedThrough the previous accurate analysis, USOIL is rising as I analyzed, and many traders have also reaped considerable profits.
The current price of USOIL is US$72.3, and downward pressure still exists. Market expectations for Russia-Ukraine negotiations are heating up. If Russian oil sanctions are lifted, increased supply will put pressure on oil prices. Bank of America analyzed that the underlying price of Brent crude oil may fall by 5-10 US dollars per barrel.
sell:72.4
Tp:71
Tp:70
Sl:73.6
TVC:USOIL FX:USOIL

USOIL BEARS WILL DOMINATE THE MARKET|SHORT
Hello, Friends!
USOIL pair is in the downtrend because previous week’s candle is red, while the price is evidently rising on the 9H timeframe. And after the retest of the resistance line above I believe we will see a move down towards the target below at 69.64 because the pair is overbought due to its proximity to the upper BB band and a bearish correction is likely.
✅LIKE AND COMMENT MY IDEAS✅

US oil for buy.Price was previously consolidating, broke out and retested the previous support zone,with a nice double bottom and a bullish pinbar. We go long.

WTI Oil Trade IdeaWTI oil has reached a key support zone and appears overextended on the four-hour chart. I'm considering a counter-trend scalp, as demonstrated in the video. This is not financial advice.


CLH2025 Breakout Setup | Bullish OutlookCLH2025 (Crude Oil Futures) is showing bullish momentum, breaking out of a descending trendline. A successful retest of the 72.50-73.00 zone could confirm a potential uptrend continuation.
🔹 Breakout Confirmation: Above 72.50
🔹 Key Support: 70.50
🔹 Potential Target: 75+ if structure holds
This setup aligns with technical breakout principles, signaling a possible trend reversal. However, this is not financial advice—just an educational market analysis. Always manage risk and do your own research before trading. 🚀📈

USOIL READY TO EXPLODE?! DON’T MISS THIS CRUCIAL MOVE!📊 USOIL (Crude Oil) Analysis – February 17
What’s up, traders? Mr. Blue Ocean FX here with another deep dive into the markets, and today, we’re breaking down US Oil (Crude Oil) and the major opportunities setting up. Let’s get straight into it.
📉 Weekly Time Frame Insight
• Last week’s candle closed with exhaustion, printing a low at 70.30 but losing volume compared to previous bearish moves.
• Key Resistance: 71.55 area was broken, signaling potential bullish momentum.
• Impulse Move: Price pushed as high as 79.44 (Jan 13th), breaking past the 77.90 October high before retesting that level.
📊 Daily Time Frame Setup
• USOIL is currently ranging in a consolidation zone, and we are at the lower region of this range.
• Buy Zone Identified:
• Three bottom touches suggest a strong support level.
• Higher low structure forming at 70.58, above the previous Feb 6th low of 70.34.
• If bulls hold this zone, we could see a strong push to the upside.
🕒 4H Time Frame Execution Plan
• Structure Confirmation: After a deep retracement, price failed to print a new low.
• Liquidity Sweep: A wick below 70.16 may have stopped early buyers before price reclaimed.
• Entry Plan:
• Buy near 70.68 (entry level).
• Stops below the recent low.
• Targeting 72.04, then 73.32, with further upside potential to 74.21+ if consolidation breaks.
• Channel Formation: USOIL is respecting an upward-sloping trend channel that could continue bouncing before a major breakout or breakdown.
🚀 What’s Next?
If bulls maintain control, we could see an explosive breakout, targeting higher liquidity zones above 74.21. However, if price breaks down, we may see another leg lower before a final push up.
🔥 What do you think? Will oil rally higher or break down? Drop your thoughts in the comments!
📢 If you found this breakdown valuable:
✅ Boost this post
✅ Share it with a fellow trader
✅ Follow for more
Let’s catch these moves! 🚀💰 #USOIL #CrudeOil #Trading #Forex #MarketBreakdown

TRADE CLOSED ON USOILI posted earlier to enter and target our DLQ, but since the market is slow and it it caught the MNQ at 71.707, we closed emmidiately.
Morning's loss recovered plus couple bucls of profit.
Follow for more!

Oil - Potential buy opportunities Hello traders, please feel free to share your trading ideas, and please give a Boost if you agree with my trading plan. My trading strategy is Price Action, which is the simplest strategy of trading on the price movement. A key part of my discipline is Stop Loss set when opening a trading position, which ensures every trading is risk managed. My 1 to 1 trading training is available, please message. Trade well and good luck!

USOIL is about to fall sharply, prepare to shortFrom a technical perspective, usoil currently has a large short-selling opportunity.
The overall price of usoil has successfully stabilized at the 70 mark, and on this basis, it has ushered in a correction market with a volatile rebound. In the afternoon European session, oil prices rose slightly, pierced the 71.2 mark, and then closed in a volatile state. From the daily K-line pattern analysis, it finally closed with a volatile rebound cross K-line.
Although the short-term price stabilized and rebounded after gaining support at the 70 mark, from a comprehensive consideration at the daily level, usoil is still in a weak volatile pattern, limited by the 10-day moving average and below the 5-day moving average. For the short-term trend, the 73 mark is the key dividing line for short weakness. At the daily level, as long as usoil fails to effectively break through and stabilize the 73 mark, any pullback can be regarded as an excellent short-selling opportunity.
usoil short-selling trading plan:
Sell: 71.55, take profit 70.5; stop loss 72.3
TVC:UKOIL TVC:USOIL

BUY USOILYou can buy USOIL and target the Daily Liquidity after that the price gave us a confirmation of a reversal.
Follow for more!

US OIL SHORT RESULT Took another hit on Crude oil.
Apparently price was going to retest our Resistance Zone twice (as seen in chart).
I taught it was going to test our Support and Trendline.
Looking forward to better TA on Oil now.
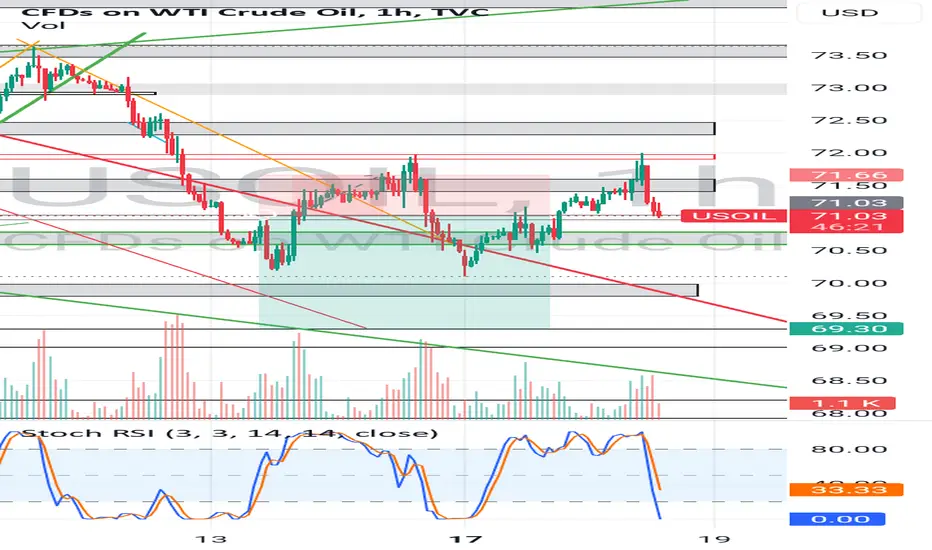
USOIL, oil trend analysis (hot news)USOIL: Due to a drone attack on a Russian oil pipeline pumping station, the oil flow from Kazakhstan has decreased. David believes that the price will rebound to the upper side soon
BUY:71.2
TP:71.6
TP:72
SL:71.00
If you agree with my analysis, please continue to pay attention. I will share my views for free later - (David)
If you don't know when to trade and want to avoid risks, you can continue to pay attention. TVC:USOIL FX:USOIL
