Choose to go short at high levels for crude oilThe price of crude oil is still fluctuating within a range and lacks clear directional momentum. The outlook remains bearish until it breaks through the $63.70 mark or there are clear factors stimulating demand. In the short term, the trend of oil prices is likely to remain confined to the current range. In terms of trading suggestions, it is advisable to mainly go short and go long as a supplement.
Oil trading strategy:
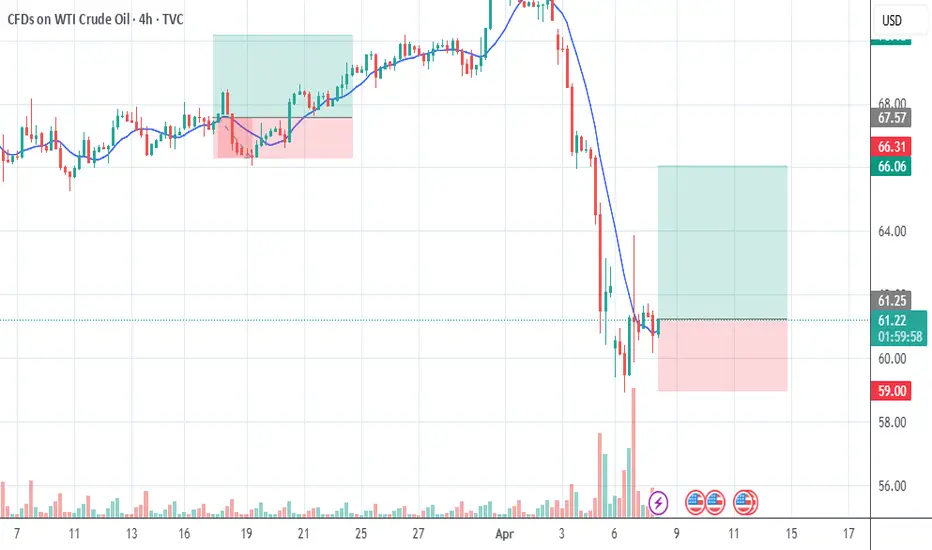
sell @ 61.90-62.10
sl 62.80
tp 61.20-61.00
If you approve of my analysis, you can give it a thumbs-up as support. If you have different opinions, you can leave your thoughts in the comments.
WTI trade ideas

Recent correlation breakdown between $USOIL and $DXYUsually, market watchers will say if the Dollar index TVC:DXY is down then commodities like Crude Oil and Gold should outperform. But recent market events have invalidated this assessment. Since 2022 we see that there is a correlation breakdown between TVC:USOIL and $DXY. These 2 indexes have been moving in tandem recently. In 2025 we saw a massive sale in the TVC:DXY and a similar downturn in the US Dollar index. With TVC:DXY below 100 and TVC:USOIL recently below 60 $, these 2 indexes are clearly indicating a US recession with low Oil demand.
IN this chart we see that the next key support levels in TVC:USOIL is 54 $. If we go below 54 $ then the next level to watch will be 35 $. That will be a recessionary scenario last seen during COVID lows. That can bring down the TVC:DXY to 90 levels. All those will indicate a deep recession which is not my base case scenario. My assessment we will see TVC:USOIL @ 55 $ and TVC:DXY @ 95 and then we will hover around those levels.
Verdict: TVC:USOIL can touch 55 $ if TVC:DXY touches 95.

USOIL BEST PLACE TO SELL FROM|SHORT
USOIL SIGNAL
Trade Direction: short
Entry Level: 63.67
Target Level: 56.31
Stop Loss: 68.58
RISK PROFILE
Risk level: medium
Suggested risk: 1%
Timeframe: 9h
Disclosure: I am part of Trade Nation's Influencer program and receive a monthly fee for using their TradingView charts in my analysis.
✅LIKE AND COMMENT MY IDEAS✅

WTI crude oil Wave Analysis – 17 April 2025
- WTI crude oil reversed from key support level 55,00
- Likely to rise to resistance level 65.00
WTI crude oil recently reversed up from the key support level 55,00 standing close to the lower daily and the weekly Bollinger Bands.
The upward reversal from this support level created the weekly Japanese candlesticks reversal pattern long-legged Doji which stopped the previous impulse waves 5 and (3).
Given the strength of the support level 55,00, WTI crude oil can be expected to rise to the next resistance level 65.00 (former multiyear support level, acting as the resistance after it was broken earlier).

OIL Approaching Critical Resistance –Will Bulls Hold Control?🔍 Price has broken above the 62.94 resistance and is now approaching the 65.75 resistance. Momentum is bullish, but the next move depends on how price reacts at this level.
📌 Marked Zones:
• Resistance: 65.75 ❌ | 68.70 🔼 | 71.88 🔼
• Support: 62.94 ⚠️ | 59.17 🔽 | 55.15 🔽
📈 Scenarios:
• Bullish Bias: A clean break and retest above 65.75 could open the way to 68.70.
• Bearish Bias: Rejection from 65.75 or failure to hold above 62.94 may lead to a drop toward 59.17.
📘 This is not financial advice. Always trade your plan.

"WTI / U.S Crude Oil" Energy Market Heist Plan (Scalping/Day)🌟Hi! Hola! Ola! Bonjour! Hallo! Marhaba!🌟
Dear Money Makers & Robbers, 🤑 💰💸✈️
Based on 🔥Thief Trading style technical and fundamental analysis🔥, here is our master plan to heist the "WTI / U.S Crude Oil" Energy Market. Please adhere to the strategy I've outlined in the chart, which emphasizes long entry. Our aim is to escape near the high-risk MA Zone. Risky level, overbought market, consolidation, trend reversal, trap at the level where traders and bearish robbers are stronger. 🏆💸"Take profit and treat yourself, traders. You deserve it!💪🏆🎉
Entry 📈 : "The vault is wide open! Swipe the Bullish loot at any price - the heist is on!
however I advise to Place buy limit orders within a 15 or 30 minute timeframe nearest or swing low or high level for pullback entries.
Stop Loss 🛑:
Thief SL placed at the Nearest / Swing low level Using the 30mins timeframe (58.000) Day trade basis.
SL is based on your risk of the trade, lot size and how many multiple orders you have to take.
🏴☠️Target 🎯: 66.000 (or) Escape Before the Target
🧲Scalpers, take note 👀 : only scalp on the Long side. If you have a lot of money, you can go straight away; if not, you can join swing traders and carry out the robbery plan. Use trailing SL to safeguard your money 💰.
💰💵💸🛢"WTI / U.S Crude Oil" Energy Market Heist Plan (Scalping/Day) is currently experiencing a bullishness,., driven by several key factors. 👇👇👇
📰🗞️Get & Read the Fundamental, Macro Economics, COT Report, Inventory and Storage Analysis, Seasonal Factors, Sentimental Outlook, Intermarket Analysis, Future trend targets & Overall Score... go ahead to check 👉👉👉🔗🔗
⚠️Trading Alert : News Releases and Position Management 📰 🗞️ 🚫🚏
As a reminder, news releases can have a significant impact on market prices and volatility. To minimize potential losses and protect your running positions,
we recommend the following:
Avoid taking new trades during news releases
Use trailing stop-loss orders to protect your running positions and lock in profits
💖Supporting our robbery plan 💥Hit the Boost Button💥 will enable us to effortlessly make and steal money 💰💵. Boost the strength of our robbery team. Every day in this market make money with ease by using the Thief Trading Style.🏆💪🤝❤️🎉🚀
I'll see you soon with another heist plan, so stay tuned 🤑🐱👤🤗🤩

WTI Crude OilWTI Crude Oil
bullish divergence ,inverse head and shoulder pattern ,ChoC and retracement to FVG, Price in Premium Discount Zone ,
Entry at Current price
stop loss 58.20
TP 65.21 with 2.4 RRR

WTI Oil H4 | Approaching a swing-high resistanceWTI oil (USOIL) is rising towards a swing-high resistance and could potentially reverse off this level to drop lower.
Sell entry is at 62.71 which is a swing-high resistance.
Stop loss is at 66.00 which is a level that sits above the 61.8% Fibonacci retracement and a pullback resistance.
Take profit is at 57.01 which is a swing-low support.
High Risk Investment Warning
Trading Forex/CFDs on margin carries a high level of risk and may not be suitable for all investors. Leverage can work against you.
Stratos Markets Limited (tradu.com):
CFDs are complex instruments and come with a high risk of losing money rapidly due to leverage. 63% of retail investor accounts lose money when trading CFDs with this provider. You should consider whether you understand how CFDs work and whether you can afford to take the high risk of losing your money.
Stratos Europe Ltd (tradu.com):
CFDs are complex instruments and come with a high risk of losing money rapidly due to leverage. 63% of retail investor accounts lose money when trading CFDs with this provider. You should consider whether you understand how CFDs work and whether you can afford to take the high risk of losing your money.
Stratos Global LLC (tradu.com):
Losses can exceed deposits.
Please be advised that the information presented on TradingView is provided to Tradu (‘Company’, ‘we’) by a third-party provider (‘TFA Global Pte Ltd’). Please be reminded that you are solely responsible for the trading decisions on your account. There is a very high degree of risk involved in trading. Any information and/or content is intended entirely for research, educational and informational purposes only and does not constitute investment or consultation advice or investment strategy. The information is not tailored to the investment needs of any specific person and therefore does not involve a consideration of any of the investment objectives, financial situation or needs of any viewer that may receive it. Kindly also note that past performance is not a reliable indicator of future results. Actual results may differ materially from those anticipated in forward-looking or past performance statements. We assume no liability as to the accuracy or completeness of any of the information and/or content provided herein and the Company cannot be held responsible for any omission, mistake nor for any loss or damage including without limitation to any loss of profit which may arise from reliance on any information supplied by TFA Global Pte Ltd.
The speaker(s) is neither an employee, agent nor representative of Tradu and is therefore acting independently. The opinions given are their own, constitute general market commentary, and do not constitute the opinion or advice of Tradu or any form of personal or investment advice. Tradu neither endorses nor guarantees offerings of third-party speakers, nor is Tradu responsible for the content, veracity or opinions of third-party speakers, presenters or participants.

US500, XAUUSD & XTIUSD Daily Trade SetupsIn this update, we review the recent price action in the US500, XAUUSD & XTIUSD and identify the next high probability trading opportunity and price objectives to target. To review today's video analysis, click here.

XTIUSD Buy Setup – 15M Entry with 4H Confluence (April 11, 2025🔍 Multi-Timeframe Confluence Strategy
This trade is a bullish entry on the 15-minute chart of Crude Oil (XTIUSD), based on a confirmed bullish structure shift on the 4H timeframe. The 15M entry aligns perfectly with HTF (higher timeframe) momentum, making this a high-probability setup.
⏰ 4H Timeframe Breakdown:
Price has broken previous 4H lower highs, confirming a structure shift from bearish to bullish.
Strong bullish engulfing candles have cleared resistance levels, turning them into new support.
Market is likely to start forming higher highs and higher lows going forward.
🧠 15-Minute Entry Logic:
Entry taken after retracement into minor 15M demand zone.
Trade executed at the point of short-term liquidity sweep, followed by bullish confirmation candle.
This creates a perfect LTF entry within HTF trend direction.
📌 Trade Setup Details:
Entry Price: Around 60.40 – 60.50
Stop Loss: Below intraday structure at 58.50
Take Profit: Targeting previous resistance at 63.40
✅ Why This Setup Works:
✅ 4H Structure Shift → Higher timeframe bias is now bullish
✅ 15M Pullback Entry → Clean risk-defined entry
✅ Liquidity Sweep → Market hunted stops before reversing (classic smart money move)
✅ Clear RR Setup → High reward for controlled risk
📢 Pro Tip:
Keep monitoring oil-related fundamentals and U.S. economic data (like inventories, geopolitical tension, etc.)—they often trigger momentum in XTIUSD.
RRR (Risk-Reward): Approx. 1:3, ideal for intra-swing or scalping objectives

WTI - Will Iran return to the group of oil producers?!WTI oil is below the EMA200 and EMA50 on the 4-hour timeframe and is moving in its medium-term descending channel. If the correction towards the supply zone continues, the next oil selling opportunity with a suitable reward for risk will be provided for us. In this direction, with confirmation, we can look for oil buying transactions.
The U.S. Energy Information Administration (EIA), in its latest report, has downgraded its forecasts for oil and natural gas production, consumption, and prices for 2025 and 2026, while warning about the uncertain outlook of the energy market amidst economic volatility and escalating trade tensions.
According to the updated estimates, U.S. crude oil production in 2025 is expected to reach 13.51 million barrels per day, down from the previous forecast of 13.61 million barrels. For 2026, the figure has been revised to 13.56 million barrels per day, a reduction from the earlier 13.76 million forecast. Monthly data shows average U.S. oil output stood at 13.44 million barrels per day in April and 13.55 million in March, with similar levels expected in May.
Globally, EIA projects oil production in 2025 to be around 104.1 million barrels per day, slightly down from the earlier estimate of 104.2 million. For 2026, the revised figure stands at 105.3 million barrels per day compared to the previous 105.8 million.
On the demand side, global oil consumption forecasts have also been reduced. In 2025, demand is now estimated at 103.6 million barrels per day instead of 104.1 million, and for 2026 it is projected at 104.7 million barrels per day, down from the prior estimate of 105.3 million.
Regarding natural gas, the EIA reports that average U.S. gas production in April will be around 115 billion cubic feet per day, slightly lower than the 115.3 billion cubic feet reported in March. May’s forecast stands at 115.4 billion cubic feet. Demand has also dipped, with estimates for 2025 now at 91.2 billion cubic feet per day (down from 92), and for 2026 at 90.5 billion (previously 91.1).
In terms of pricing, EIA has made significant downward revisions. The average price of West Texas Intermediate (WTI) crude oil is now forecast to be $63.88 per barrel in 2025, compared to the earlier $70.68. For 2026, this drops further to $57.48. Brent crude is now estimated at $67.87 for 2025 and $61.48 for 2026, both notably lower than prior projections.
One key highlight from the report is EIA’s warning about high volatility in major commodity prices, especially crude oil. The agency underlined that reciprocal tariffs between China and the U.S. could heavily impact markets, particularly the propane sector.
EIA noted that U.S. liquefied natural gas (LNG) exports are likely to remain resilient despite trade disputes. This is attributed to strong global demand and the flexible nature of U.S. export contracts, which allow unrestricted shipments to multiple destinations.
However, when it comes to oil and petroleum products, the agency maintained a more cautious tone, emphasizing that recent shifts in global trade policies and oil production patterns may slow the growth of demand for petroleum-based products through 2026.
Altogether, the downward revisions by the EIA carry a clear message: the energy market outlook over the coming years is fraught with uncertainty. From supply and demand to pricing, political and economic forces such as trade wars and potential global recessions are expected to play decisive roles.
Meanwhile, according to Reuters, after U.S. President Donald Trump once again threatened military action if Tehran refuses to agree to a nuclear deal, a senior Iranian official responded by warning that Iran may halt its cooperation with the U.N.’s nuclear watchdog.
Reports indicate that American and Iranian diplomats will meet in Oman on Saturday to begin talks on Tehran’s nuclear program. Trump stated that he would have the final say on whether the negotiations are failing, which could place Iran in a highly dangerous position.
Ali Shamkhani, a senior adviser to Iran’s Supreme Leader, posted on X (formerly Twitter) that ongoing foreign threats and the looming threat of military confrontation could lead to deterrent actions such as expelling International Atomic Energy Agency (IAEA) inspectors and cutting ties with the agency.He also mentioned that relocating enriched uranium to secure, undisclosed locations within Iran may be under consideration

Bullish bounce?USO/USD has bounced off the support level which is a pullback support that lines up with the 50% Fibonacci retracement and could potentially rise from this level to our take profit.
Entry: 58.96
Why we like it:
There is a pullback support level that lines up with the 50% Fibonacci retracement.
Stop loss: 56.81
Why we like it:
There is a pullback support level that lines up with the 78.6% Fibonacci retracement.
Take profit: 63.23
Why we like it:
There is a pullback resistance level.
Enjoying your TradingView experience? Review us!
Please be advised that the information presented on TradingView is provided to Vantage (‘Vantage Global Limited’, ‘we’) by a third-party provider (‘Everest Fortune Group’). Please be reminded that you are solely responsible for the trading decisions on your account. There is a very high degree of risk involved in trading. Any information and/or content is intended entirely for research, educational and informational purposes only and does not constitute investment or consultation advice or investment strategy. The information is not tailored to the investment needs of any specific person and therefore does not involve a consideration of any of the investment objectives, financial situation or needs of any viewer that may receive it. Kindly also note that past performance is not a reliable indicator of future results. Actual results may differ materially from those anticipated in forward-looking or past performance statements. We assume no liability as to the accuracy or completeness of any of the information and/or content provided herein and the Company cannot be held responsible for any omission, mistake nor for any loss or damage including without limitation to any loss of profit which may arise from reliance on any information supplied by Everest Fortune Group.

WTI CRUDE OIL: Potential bottom and massive rebound to 71.00.WTI Crude Oil got oversold on its 1D technical outlook (RSI = 31.096, MACD = -1.620, ADX = 38.232) but is recovering its 1W candle now as it hit the bottom (LL) of the 1 year Channel Down. If the 1W candle makes a green closing, we will consider this a bottom, as the 1W RSI is also on its LL trendline) and go for a long aimed as the previous one at the 0.618 Fibonacci (TP = 71.00).
## If you like our free content follow our profile to get more daily ideas. ##
## Comments and likes are greatly appreciated. ##

CRUDE OIL (WTI): Important Support Clusters to Watch
On a today's live stream, we discussed potentially significant
historic supports on WTI Crude Oil to watch.
Support 1: 57.0 - 59.0 area
Support 2: 52.5 - 54.6 area
Support 3: 48.8 - 50.4 area
Support 4: 40.6 - 43.7 area
The price is currently testing a lower boundary of Support 1.
It perfectly matches with a completion point of a harmonic ABCD pattern.
It looks like we may see some pullback soon.
❤️Please, support my work with like, thank you!❤️

USOIL SENDS CLEAR BULLISH SIGNALS|LONG
USOIL SIGNAL
Trade Direction: long
Entry Level: 57.67
Target Level: 66.44
Stop Loss: 51.82
RISK PROFILE
Risk level: medium
Suggested risk: 1%
Timeframe: 12h
Disclosure: I am part of Trade Nation's Influencer program and receive a monthly fee for using their TradingView charts in my analysis.
✅LIKE AND COMMENT MY IDEAS✅

WTI - buy here or wait for 68$ My analysis of WTI in early December was good and it did wat I expected, but a stupid stop kicked me out it wave 2.
Then got the perfect entry for the short at 80.5 but didn't hold long enough...
So what to do next ? Could buy it here at the 0.236 retracement but I'd rather buy at 68.5 with a stop at 67.
Always keep in mind there is also politics involved here. Oil producers need higher prices to be profitable but on the other hand they want the price of oil to drop so Russia cannot sustain their war in Ukraine.

WTI OIL Buy opportunity or more meltdown coming?WTI Oil (USOIL) has been trading within a long-term Channel Down since the September 25 2023 High and the recent Trade War sell-off helped the price drop towards the pattern's bottom (Lower Lows trend-line) much quicker.
Technically this has been a 1W MA50 (blue trend-line) rejection, previously a Lower High rejection on the 1W MA200 (orange trend-line). Notice how the 1W RSI has also been trading within a Channel Down of its own, with the indicator near its bottom as well.
Being more than -31% down (more than the -29% of the first Bearish Leg), we can technically claim that this is a solid level for a medium-term buy again. The previous Bullish Leg marginally exceeded the 0.618 Fibonacci retracement level before the Lower High. As a result, our new Target is $70.00.
-------------------------------------------------------------------------------
** Please LIKE 👍, FOLLOW ✅, SHARE 🙌 and COMMENT ✍ if you enjoy this idea! Also share your ideas and charts in the comments section below! This is best way to keep it relevant, support us, keep the content here free and allow the idea to reach as many people as possible. **
-------------------------------------------------------------------------------
Disclosure: I am part of Trade Nation's Influencer program and receive a monthly fee for using their TradingView charts in my analysis.
💸💸💸💸💸💸
👇 👇 👇 👇 👇 👇

USOIL Oil – April 10, 2025
Price Action & Trend Analysis:
- Current Market Position:
- WTI Crude Oil is showing a bearish trend within a falling wedge pattern, a technical formation that often signals a potential breakout after consolidation. This pattern is visible with converging trendlines (blue), which suggest a potential move to the downside.
- The resistance zone is marked at 61.50, and the price is struggling to break above this level. If it does not break out of this level, further downside momentum may be expected.
Key Levels:
1. Resistance Zone:
- The resistance level is clearly marked near 61.50, and price action has repeatedly struggled to move above this level, showing signs of rejection. A failure to break this l…
ChatGPT: 4. FVG (Fair Value Gap):
- There is a Fair Value Gap (FVG) near 58.12, which indicates a possible area of imbalance where price could potentially retrace to fill the gap before moving in its next direction.
Volume Analysis:
- The volume profile indicates decreasing volume as the price approaches the resistance zone at 61.50, which may suggest a weakening of bullish momentum.
- The increasing volume near the support level at 58.00 suggests that buyers are looking to step in at these levels, but this remains to be seen as the price moves toward this region.
Key Observations:
- The bearish divergence observed between price and momentum suggests that bearish pressure is mounting, especially with the price failing to breach resistance and forming lower highs.
- T

OIL PULLBACK 58-59 Then go up to 75-80OIL PULLBACK 58-59 Then go up to 75-80. Buy limit 58-59 sl 56.5 tp75-80

USOIL CATCHING THE FALLING KNIFE|LONG|
✅CRUDE OIL lost 18% of it's
Value in the last 5 days on the
Trade war news, which makes
The market to expect a recession
And a sharp drop in the oil demand
However, I still think that Oil
Is locally oversold, therefore
A local bullish correction is
To be expected from the
Horizontal support below
Around 57.34$ and the
Target being the resistance
Above around 61.81$
LONG🚀
✅Like and subscribe to never miss a new idea!✅
Disclosure: I am part of Trade Nation's Influencer program and receive a monthly fee for using their TradingView charts in my analysis.

WTI Crude Oil Analysis: My Bearish Outlook Towards $25.OANDA:WTICOUSD
We need to shift to the weekly chart to better understand the potential downside for OANDA:WTICOUSD Crude Oil.
Crude Oil has already broken below the daily, weekly, and monthly fractal support levels. The drop below the monthly fractal support at $65.65 has opened up the potential for a significant decline. With this key support level breached, Crude Oil is now at risk of testing much lower levels, possibly approaching the April lows. This would create the possibility of a bullish bat pattern forming around $24.88, signaling a potential reversal from these much lower prices.
On the resistance side, the monthly fractal resistance at $80.75 continues to be a major barrier, as well as the weekly fractal resistance, which reinforces the difficulty of any upward movement. The daily fractal resistance at $72.48 remains another obstacle for any short-term recovery attempts.
As for the support levels, Crude has already broken below the daily fractal support at $69.07 and the weekly fractal support at $65.40. These breaches now threaten the monthly fractal support at $65.65, confirming the bearish sentiment in the market. With these key levels broken, the market is showing clear signs of weakness, and the potential for further downside movement remains high.
At this stage, we should be cautious and watch closely for signs of a bottoming formation or a reversal pattern, but the immediate outlook suggests further downside risk.
Happy Trading,
André Cardoso

Crude Oil Found Support: What's Next?FenzoFx—Crude oil tested the $58.9 level as support and bounced back from it. The primary trend is bearish; therefore, it will likely resume if the price closes and stabilizes below this support.
If this scenario unfolds, the next bearish target could be the $55.15 support level.
>>> Win $160.0 prize every week by joining FenzoFx contest.

usoil buy tradeThe Relative Strength Index (RSI) is showing an upward trend, indicating increasing momentum. Additionally, the Moving Average Convergence Divergence (MACD) is showing a bullish crossover, further supporting the potential for an upward move.