US OilCrude Oil
- Falling Wedge as an corrective pattern in Short Time Frame
- Break of Structure
- S / R Level
- Completed " 12345 " Impulsive Waves and " A " Corrective Waves
- Demand Zone
WTI trade ideas

Long WTIUS10Y yield (white) and WTI typically trade in lockstep, but have recently diverged with US10Y rebounding while WTI has continued to observe selling pressure.
Expecting divergence to narrow, with WTI moving higher off recent lows. Entering long positions on WTI contracts.

US OIL SHORT RESULT Crude oil price action moved exactly in our Prediction and even Better.
Currently the price is in a new Bullish trend due to the FOMC news, but we'll watch it to see if it holds and it's authenticity before Opening new trades to ensure it's not just hype or manipulation.

OIL TO PUMP UPOil has broken the downtrend and turned bullish. Tump's Iran threads is also likely to accelerate the bullish push faster.
Risk no more than one per cent.
Swing trade so expect to hold it for weeks
Once trade over 200 pips in profit, set breakeven
Follow us for more perfect swing setups

USOIL:You need to refer to this strategyPresident Trump of the United States suddenly announced the suspension of tariffs, which led to a significant change in market sentiment.
Since tariffs play a crucial role in global economic relations and market expectations, this unexpected move has caused investors to adjust their investment portfolios.
As the new tariff suspension policy has reduced market uncertainties to a certain extent, gold, which is usually regarded as a safe-haven asset, has been sold off.
Conversely, the price of USOIL has soared, reflecting the market's rapid response to this major policy change.
If you're at a loss right now, don't face it alone. Please contact me. We are always ready to fight side by side with you.

Bears to scoop the Oil all the way to the 42.00 zone U.S. oil prices have extended their losses this Wednesday, plunging by more than 6% after China just announced it has raised tariff trade duty on goods from the United States from 34% to 84% starting 10th April in response to US President Donald Trump's tariffs, including a cumulative levy rate of 104% on Chinese imports. Traders are now remaining wary of investing amid United States President Donald Trump's tariffs on other countries and specific imports, despite the continued turmoil in the Middle East,
That being said I'm with the bears on this one
sell @after retest @60.00
1st Tp @42.00
Crude oil is in big trouble...no quarterly closes below 67$
THIS MUST HOLD
recession 2001
recession 2008
recession?

Oil holds below $60: demand likely down, supply upSince the announcement of higher than expected new American tariffs, especially on China, oil’s decline has been dramatic. The very high tariffs on China are important because China is the largest importer of oil, so economic headwinds there usually have a significant effect on demand. OPEC+ decided last week to increase supply next month.
4 April was American light oil’s lowest weekly close since August 2021, so it’s difficult to estimate the next potential support. The 78.6% monthly Fibonacci retracement is around $40, but even in the circumstances that’s a very long way from where the price is now. The unusual strength of the oversold signal and the size of recent candlesticks call into question whether the price might continue immediately lower unless significant fresh trade news reaches markets.
Equally, buying oil now looks like trying to ‘catch the knife’. Fundamentals are quite strongly negative and 7 April’s failed bounce suggests that demand is likely to remain low for some time unless there’s another round of strong losses or the tone of the news changes. Short-term trading of retracements seems to be the least bad option now.
This is my personal opinion, not the opinion of Exness. This is not a recommendation to trade.

USOILUSOIL will continue to drop,the geopolitical tension and china trade war will shift demand to black market where oil is discounted ,usoil will experience poor demand pushing for lower price ,

WTI Wave Analysis – 8 April 2025
- WTI broke the long-term support zone
- Likely to fall to support level 55.00
WTI crude oil recently broke the long-term support zone set between the support levels 60.00 and 65.00. This support zone has stopped all downward corrections from the middle of 2021.
The breakout of this support zone accelerated the active downward impulse wave 3, which belongs to the intermediate impulse wave (3) from the start of 2024.
Given the strong downtrend seen on the weekly WTI charts, WTI crude oil can be expected to fall to the next support level 55.00, the target price for the completion of the active impulse wave (3).

WTI Continues Sharp Decline and Enters Oversold TerritoryOver the past five trading sessions, oil prices have dropped more than 17% , with WTI crude falling below the $60 per barrel mark. This move reflects ongoing market uncertainty, as investors expect the new trade war to significantly weaken oil demand in the coming months. As long as confidence remains in a fragile zone, downward pressure on oil prices is likely to persist.
Break of the Sideways Channel
In recent weeks, a key sideways channel that had held since November 2023 has been broken. This shift could alter the neutral outlook that has dominated the oil market in the long term and now points toward seller dominance. As price movements stabilize, a stronger bearish trend may begin to develop in the short term.
Oversold Conditions Appear
RSI: The RSI line is currently holding below the 30 level, which signals oversold conditions on the indicator. This suggests that while bearish pressure has been dominant, the market may be entering an early stage of exhaustion, potentially opening the door for short-term bullish corrections.
Bollinger Bands: The price has completely broken through the lower Bollinger Band, indicating that it has moved beyond two standard deviations from the mean. This reflects high volatility and could signal a pause in selling momentum. In turn, it may lead to potential rebound zones forming soon.
Key Levels:
$58 – Near Support: This is the most important short-term barrier, aligning with multi-year lows not seen since 2021. Continued selling below this level could reinforce the current bearish bias.
$66 – Near Resistance: This level marks the lower boundary of the former sideways channel. It may act as a potential zone for bullish corrections in the short term.
$73 – Distant Resistance: This level aligns with the 200-period moving average. Price action approaching this area could reactivate the previously abandoned uptrend.
By Julian Pineda, CFA – Market Analyst

USOIL ChatGPT: Chart Analysis for WTI Crude Oil (1-Hour Timeframe) – April 08, 2025
Key Observations:
1. Trend and Price Action:
- WTI Crude Oil has been trading in a range-bound pattern, as shown by the blue trendlines. The price has been bouncing between the resistance and support levels. Currently, the price is at the lower end of this range near the support level around 58.88.
- The resistance level is at 59.05, and this has been tested multiple times without a sustained breakout, indicating that sellers have been in control around this level.
- The price just tested the support level and bounced slightly higher, which suggests the market may be consolidating before deciding the next move.
2. Order Block and FVG (Fair Value Gap):
- The order block is located…
ChatGPT: - Fair Value Gap (FVG) has been formed around the order block. This means there’s an imbalance in the market that could eventually be filled. Traders should watch for price action near this gap for further insight into whether the gap will be filled or left untested.
3. Volume:
- Volume is relatively low, which suggests a lack of strong momentum in the market. This is typical in range-bound markets, where buying and selling activity are often balanced.
- However, the volume has spiked during the downward move, which could indicate a potential bearish continuation if the price breaks below 58.88.
4. Bearish Setup and Target:
- The chart is showing a bearish setup with the price trading below the resistance zone, and it is testing the support level near

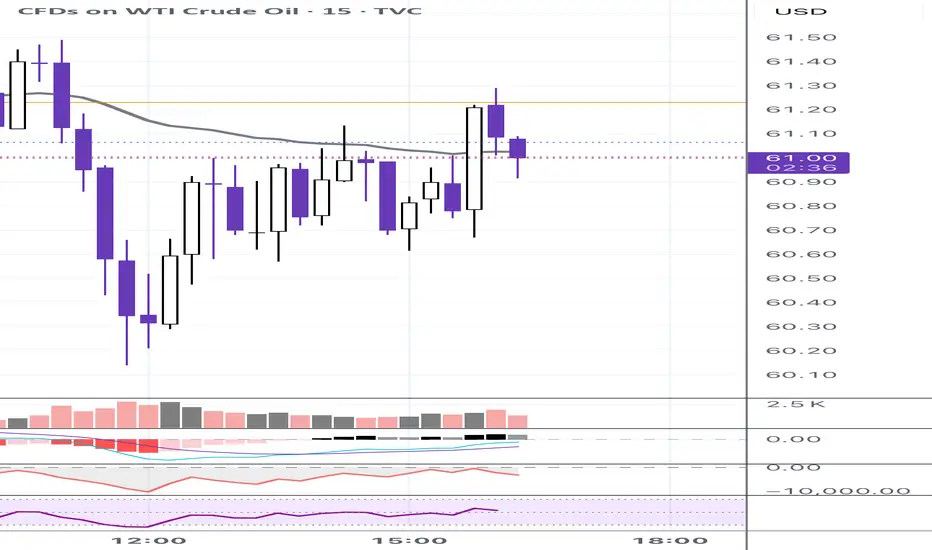
Buy oil! Target 63-65!Crude oil is currently in a short position overall, and the rebound momentum is relatively weak. However, in the short-term structure, oil has shown obvious signs of stopping the decline, and the support of the 60-59 area below is still valid.
After hitting the low point of 58.9, oil began to rebound, and the rebound low gradually shifted upward. At present, oil holds the support near 60, and is expected to build a W-bottom structure in the short-term structure, which is conducive to further rebound of oil prices.
Therefore, in terms of short-term trading, you can try to go long on crude oil in the 60.5-59.5 area, and the rebound target will first look at 63, followed by 65
The trading strategy verification accuracy rate is more than 90%; one step ahead, exclusive access to trading strategies and real-time trading settings

Plotted by TrumpI’ve been telling people that this is just a panic sell that people are doing, just keep your position no matter which price it goes to. 55,50,45,40. Its okay because ive advised to buy crude without leverage for investing. Its time to buy more actually!
I got some more positions yesterday, and might get another if it falls to 55. 👌
Keep it up because our trades will be profitable😁
Trump Goes "The Peacemaker", as Crude Oil Turns Gradually LowerThe notion that crude oil prices might decrease due to an abatement of the Ukraine's war not seems to be counterintuitive, as the conflict has historically led to increased oil prices due to supply disruptions and geopolitical tensions.
There are several factors that could contribute to a decrease in oil prices if tensions were to ease.
Factors Contributing to Decreased Oil Prices:
Easing of Sanctions on Russia: If tensions between the U.S. and Ukraine were to ease, it might lead to a relaxation of sanctions on Russia, potentially allowing more Russian oil to enter the global market. This increase in supply could help reduce prices.
Market Perception of Reduced Conflict: The market might perceive a decrease in conflict as a sign of reduced risk to global oil supplies, leading to lower prices. This perception could be influenced by expectations of increased oil availability from Russia and other regions.
OPEC Production Increases: If OPEC decides to increase production, as it has recently done, this could add more oil to the market, further pressuring prices downward.
Global Economic Concerns: Economic slowdowns or concerns about global growth can reduce demand for oil, leading to lower prices. The Ukraine conflict has contributed to economic uncertainty, and its abatement might not necessarily increase demand if global economic concerns persist.
Fundamental considerations
Well, in early March 2025, oil prices fell due to a combination of factors, including tensions between the U.S. and Ukraine and OPEC's decision to gradually increase output. Brent crude fell to around $71.08 per barrel, and WTI to about $68.01 per barrel.
Impact of Sanctions: Despite sanctions not directly targeting Russian oil, they have affected its exports by limiting financing and causing some buyers to avoid Russian crude. Easing these sanctions could increase Russian oil exports, potentially lowering global prices.
Market Dynamics: The war in Ukraine initially caused oil prices to surge due to supply concerns. However, if the conflict were to abate, market dynamics could shift, leading to decreased prices as supply risks diminish and global economic factors come into play.
Post war challenge
Crude oil and gasoline prices today are moderately lower, but crude oil tends to breakthrough a long-term 3 - to - 4 years low.
Crude oil prices are under pressure as US tariff uncertainty weighs on the outlook for energy demand.
Also, ramped-up Russian oil exports boost global supplies and are negative for prices.
In addition, crude prices have some negative carryover from Wednesday when weekly EIA crude inventories rose more than expected to a 7-month high.
Conclusion
In summary, while the Ukrainian war has historically driven oil prices up due to supply disruptions and geopolitical tensions, an easing of tensions could lead to decreased prices through increased supply, reduced market risk, and global economic factors.
--
Best 'Peacemaking' wishes,
@PandorraResearch Team 😎

USOIL / WTI Futures OversoldWTI looks very oversold here and there are too many catalysts not to buy right now. Positive catalysts would happen on 'good news' related to tariffs/trade war, but catalysts could also be negative developments concerning (trade)war globally and opec.

Market Analysis: WTI Crude Oil Crashes As Trade War EscalatesMarket Analysis: WTI Crude Oil Crashes As Trade War Escalates
WTI Crude oil is down over 10% and remains at risk of more losses.
Important Takeaways for WTI Crude Oil Prices Analysis Today
- WTI Crude oil prices extended downsides below the $65.00 support zone.
- A major bearish trend line is forming with resistance near $60.70 on the hourly chart of XTI/USD at FXOpen.
WTI Crude Oil Price Technical Analysis
On the hourly chart of WTI Crude Oil at FXOpen, the price struggled to continue higher above $72.00 against the US Dollar. The price formed a short-term top and started a fresh decline below $70.00.
There was a steady decline below the $65.60 pivot level. The bears even pushed the price below $62.20 and the 50-hour simple moving average. Finally, the price tested the $59.20 zone. The recent swing low was formed near $59.21, and the price is now consolidating losses.
There was a minor move above the $60.00 level. On the upside, immediate resistance is near the $60.70 level. There is also a major bearish trend line forming with resistance near $60.70.
The next resistance is near the $62.20 level and the 23.6% Fib retracement level of the downward move from the $71.97 swing high to the $59.21 low. The main resistance is near a trend line at $65.60.
The 50% Fib retracement level of the downward move from the $71.97 swing high to the $59.21 low is also near $65.60. A clear move above the $65.60 zone could send the price toward $68.70. The next key resistance is near $71.85. If the price climbs further higher, it could face resistance near $72.20. Any more gains might send the price toward the $75.00 level.
Immediate support is near the $59.20 level. The next major support on the WTI crude oil chart is near $58.00. If there is a downside break, the price might decline toward $55.00. Any more losses may perhaps open the doors for a move toward the $52.00 support zone.
This article represents the opinion of the Companies operating under the FXOpen brand only. It is not to be construed as an offer, solicitation, or recommendation with respect to products and services provided by the Companies operating under the FXOpen brand, nor is it to be considered financial advice.

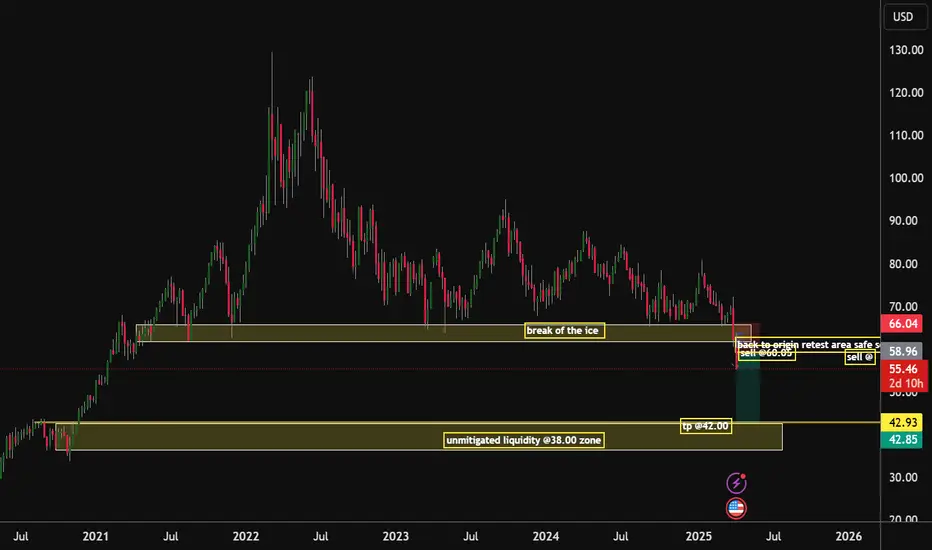
Tariff Panic = Opportunity | WTI Long SetupWTI Oil has finally dipped into my long-watched buy zone, driven by macro fear and an aggressive tariff agenda. The current drop aligned perfectly with my long-term execution plan. I’ve placed this trade based on key historical demand levels with my stop-loss and take-profit clearly defined. I’m prepared for deeper drawdown, but this area remains high-conviction for me. Execution > Prediction.
Technicals:
• Key Level: Price tapped into a major demand zone dating back to 2021 lows, which had been protected ever since.
• Liquidity Sweep: This drop mitigated every low formed post-2021 — clearing out late longs and stop hunts.
• Trendline Break Anticipation: I expect a potential trendline breakout from the long-term descending structure.
• SL/TP Defined: This trade has structure. It’s not a hope-based setup, it’s pre-planned and managed.
• Consolidation + Accumulation: This is where strong hands prepare, and I’m joining in.
Fundamentals:
• Tight supply, rising global demand, and structural underinvestment in oil exploration.
• Chinese reopening + Russian ban tighten market availability.
• Central banks expected to support demand via easing cycles.
• Oil Bearish Catalyst (Short-Term):
• US tariff wave: Trump announced a total 54% tariff on China and baseline tariffs on all trading partners.
• Escalating fears of global economic slowdown pushed prices to $58.80, a 4-year low.
The bearish panic gave bulls like us a gift. This is how real trades are born - not in euphoria, but in blood.
Note: Please remember to adjust this trade idea according to your individual trading conditions, including position size, broker-specific price variations, and any relevant external factors. Every trader’s situation is unique, so it’s crucial to tailor your approach to your own risk tolerance and market environment.

WTI Oil H1 | Bearish downtrend to extend further?WTI oil (USOIL) could rise towards a pullback resistance and potentially reverse off this level to drop lower.
Sell entry is at 59.52 which is a pullback resistance.
Stop loss is at 61.50 which is a level that sits above a pullback resistance.
Take profit is at 57.37 which is a swing-low support.
High Risk Investment Warning
Trading Forex/CFDs on margin carries a high level of risk and may not be suitable for all investors. Leverage can work against you.
Stratos Markets Limited (www.fxcm.com):
CFDs are complex instruments and come with a high risk of losing money rapidly due to leverage. 63% of retail investor accounts lose money when trading CFDs with this provider. You should consider whether you understand how CFDs work and whether you can afford to take the high risk of losing your money.
Stratos Europe Ltd (www.fxcm.com):
CFDs are complex instruments and come with a high risk of losing money rapidly due to leverage. 63% of retail investor accounts lose money when trading CFDs with this provider. You should consider whether you understand how CFDs work and whether you can afford to take the high risk of losing your money.
Stratos Trading Pty. Limited (www.fxcm.com):
Trading FX/CFDs carries significant risks. FXCM AU (AFSL 309763), please read the Financial Services Guide, Product Disclosure Statement, Target Market Determination and Terms of Business at www.fxcm.com
Stratos Global LLC (www.fxcm.com):
Losses can exceed deposits.
Please be advised that the information presented on TradingView is provided to FXCM (‘Company’, ‘we’) by a third-party provider (‘TFA Global Pte Ltd’). Please be reminded that you are solely responsible for the trading decisions on your account. There is a very high degree of risk involved in trading. Any information and/or content is intended entirely for research, educational and informational purposes only and does not constitute investment or consultation advice or investment strategy. The information is not tailored to the investment needs of any specific person and therefore does not involve a consideration of any of the investment objectives, financial situation or needs of any viewer that may receive it. Kindly also note that past performance is not a reliable indicator of future results. Actual results may differ materially from those anticipated in forward-looking or past performance statements. We assume no liability as to the accuracy or completeness of any of the information and/or content provided herein and the Company cannot be held responsible for any omission, mistake nor for any loss or damage including without limitation to any loss of profit which may arise from reliance on any information supplied by TFA Global Pte Ltd.
The speaker(s) is neither an employee, agent nor representative of FXCM and is therefore acting independently. The opinions given are their own, constitute general market commentary, and do not constitute the opinion or advice of FXCM or any form of personal or investment advice. FXCM neither endorses nor guarantees offerings of third-party speakers, nor is FXCM responsible for the content, veracity or opinions of third-party speakers, presenters or participants.

Multiple support for USOIL at 65.84 price levelWell, had you bought it at the support level, good. Fret not if you missed it.
For those who are more risk averse, you can wait for the breakout of the bearish channel first.
Please DYODD

USOIL - ANALYSIS👀 Observation:
Hello, everyone! I hope you're doing well. I’d like to share my analysis of WTI Crude Oil (U.S. Oil) with you.
Looking at the WTI Crude Oil chart, we are currently in a 6-month price range, and right now, we're at the lower boundary of this range. I have two scenarios for oil:
Bullish Scenario: We might see a price increase from here towards 85.30 on the higher timeframes.
Bearish Scenario: If we close below 61.70 on the monthly timeframe, I expect a significant decline in price towards 41.62.
📉 Expectation:
Bullish Scenario: Price may rise to 85.30.
Bearish Scenario: If price closes below 61.70, expect a decline to 41.62.
💡 Key Levels to Watch:
Support: 61.70
Resistance: 85.30
💬 What are your thoughts on WTI Crude Oil this week? Let me know in the comments!
Trade safe

Crude Oil: A Major Breakdown in the Making?Last Friday, April 4th, 2025, crude oil decisively broke below a key long-term support level that had held strong since late November 2021.
This significant downside breakout, if confirmed, could mark a major shift in the oil market structure — potentially opening the door for a deeper decline.
Based on Elliott Wave analysis, it appears that wave B has been completed in the form of a contracting triangle, and we are now likely entering wave C. According to Fibonacci projections, wave C could extend down toward the $41–$44 range, which represents roughly a 28% drop from current levels.
From a chart pattern perspective, price action has also broken down from a descending triangle — a classic bearish pattern — with a projected target that aligns closely with the Elliott Wave count around $44.
Moreover, this entire bearish move, which began in early June 2022, fits neatly within a descending channel — further validating the confluence of technical signals.
Breaking below such a well-established support zone alone could be a strong bearish signal. But when this is backed by Elliott Wave structure, pattern projection, and broader macroeconomic concerns, it suggests a high-probability short opportunity in crude oil.

USOIL: Long Trade with Entry/SL/TP
USOIL
- Classic bullish formation
- Our team expects growth
SUGGESTED TRADE:
Swing Trade
Buy USOIL
Entry Level - 62.27
Sl - 60.60
Tp - 65.58
Our Risk - 1%
Start protection of your profits from lower levels
Disclosure: I am part of Trade Nation's Influencer program and receive a monthly fee for using their TradingView charts in my analysis.
❤️ Please, support our work with like & comment! ❤️
