Silver- sell on rallies (breaks major trend line support)
Trend line support- $31.95 (trend line joining $28.79 and $30.81)
Silver crashed more than 7% after Tariff announcement. It hit a intraday low of $31.40 and is currently trading around $31.65.
The gold/silver ratio climbed to 95.50, reflecting silver's relative weakness compared to gold.
Trading Strategy and Key Levels for Silver
The commodity is trading below short term (34 and 55 EMA) and long-term moving average (200- EMA) in the 4-hour chart. The near-term support is around $31.25 and any violation below will drag the commodity to $30.75/$30/$29.60/$29/$28.40. The immediate resistance is at $32.60 any breach above targets $33/$35/$36.
It is good to sell on rallies around $32 with a stop-loss at $32.60 for a TP of $30/$28.40.
XAGUSD trade ideas

SILVER Strong Support Ahead! Buy!
Hello,Traders!
SILVER got decimated
By the bears last week
And lost almost 15%
Of its value, which is
Clearly an overreaction
And an oversold situation
So after the potential retet
Of the strong horizontal
Support below around 28.97$
On Monday we are likely
To see a bullish correction
Buy!
Comment and subscribe to help us grow!
Check out other forecasts below too!
Disclosure: I am part of Trade Nation's Influencer program and receive a monthly fee for using their TradingView charts in my analysis.

Silver (XAG/USD) – Long Setup IdeaSilver (XAG/USD) – Long Setup Idea
Silver is currently trading around $31.30, while gold has surpassed the $3,000 mark, pushing the Gold/Silver Ratio (GSR) above 99 – a level that historically signals strong upside potential for silver. Industrial demand is surging, especially from solar energy, EVs, and electronics, with silver consumption expected to exceed 700 million ounces in 2025. Analysts from Capital Economics, UBS, and Citi forecast a price target of $36–38 in the next few months, supported by a persistent supply deficit and investor rotation from gold into undervalued silver.
🎯 Take Profit: $36.00
⏱️ Timeframe: 1–3 months
📊 Bias: Bullish
📉 Risk: Correction below $29 in case of weak macro or strong USD


Buy SilverAs long as there is no break in the uptrend on the daily chart, a long position can be attempted from the current level with a target of the previous highs at 34.80-35.00
Since the trade is taking place during a period of high volatility and the entry is not the most stable, it is better to trade with a stop-loss, adjusting it throughout the day as the price moves up.
The first stop is at 31.70. Then, if 32.50 is broken, move it to 32.10, and so on.

SILVER LONG SIGNAL|
✅SILVER fell down sharply
By more than 15% which is
A lot so Silver is clearly oversold
Therefore we can enter a long
Trade with the TP of 30.19$
And the SL of 28.71$
LONG🚀
✅Like and subscribe to never miss a new idea!✅
Disclosure: I am part of Trade Nation's Influencer program and receive a monthly fee for using their TradingView charts in my analysis.


SILVER INTRADAY pullback to support at 3090Silver maintains a bullish sentiment, in line with the prevailing uptrend. Recent intraday price action suggests a corrective pullback, potentially retesting the previous consolidation zone for support.
Key Level: 3090
This zone represents a significant area of prior consolidation and now acts as a key support level.
Bullish Scenario:
A pullback toward 3090 followed by a bullish bounce would confirm continued upside momentum. Immediate resistance targets include 3266, with extended upside potential toward 3350 and 3450 over the longer term.
Bearish Alternative:
A confirmed breakdown and daily close below 3090 would negate the current bullish outlook. This would open the door for a deeper retracement toward 3028, followed by 2945.
Conclusion:
Silver remains technically bullish while trading above 3090. A successful retest and rebound from this level would support further upside. However, a daily close below 3090 would shift sentiment bearish in the short term, increasing the risk of a deeper correction.
This communication is for informational purposes only and should not be viewed as any form of recommendation as to a particular course of action or as investment advice. It is not intended as an offer or solicitation for the purchase or sale of any financial instrument or as an official confirmation of any transaction. Opinions, estimates and assumptions expressed herein are made as of the date of this communication and are subject to change without notice. This communication has been prepared based upon information, including market prices, data and other information, believed to be reliable; however, Trade Nation does not warrant its completeness or accuracy. All market prices and market data contained in or attached to this communication are indicative and subject to change without notice.

Bearish drop?The Silver (XAG/USD) has reacted off the pivot and could drop to the 1st support.
Pivot: 31.91
1st Support: 30.92
1st Resistance: 32.68
Risk Warning:
Trading Forex and CFDs carries a high level of risk to your capital and you should only trade with money you can afford to lose. Trading Forex and CFDs may not be suitable for all investors, so please ensure that you fully understand the risks involved and seek independent advice if necessary.
Disclaimer:
The above opinions given constitute general market commentary, and do not constitute the opinion or advice of IC Markets or any form of personal or investment advice.
Any opinions, news, research, analyses, prices, other information, or links to third-party sites contained on this website are provided on an "as-is" basis, are intended only to be informative, is not an advice nor a recommendation, nor research, or a record of our trading prices, or an offer of, or solicitation for a transaction in any financial instrument and thus should not be treated as such. The information provided does not involve any specific investment objectives, financial situation and needs of any specific person who may receive it. Please be aware, that past performance is not a reliable indicator of future performance and/or results. Past Performance or Forward-looking scenarios based upon the reasonable beliefs of the third-party provider are not a guarantee of future performance. Actual results may differ materially from those anticipated in forward-looking or past performance statements. IC Markets makes no representation or warranty and assumes no liability as to the accuracy or completeness of the information provided, nor any loss arising from any investment based on a recommendation, forecast or any information supplied by any third-party.

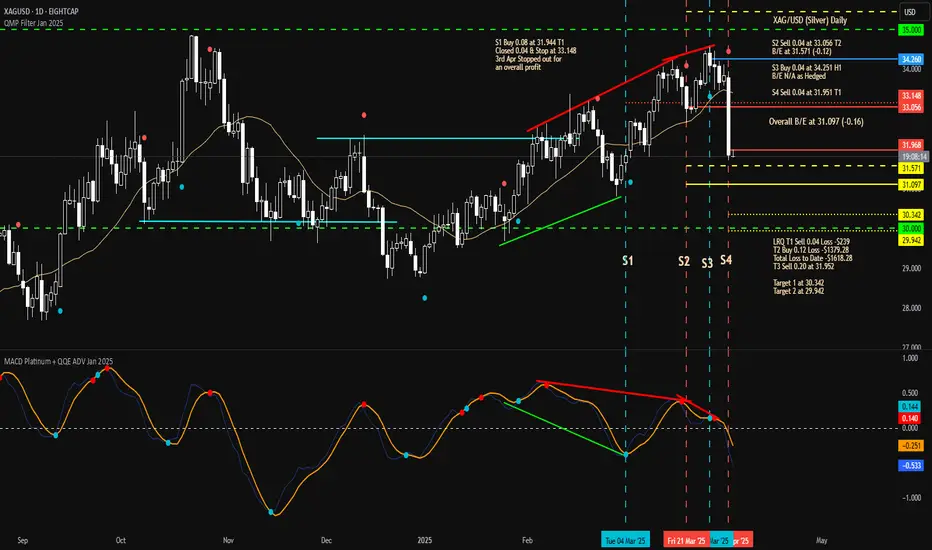
Fri 4th Apr 2025 XAG/USD Daily Forex Chart Sell SetupGood morning fellow traders. On my Daily Forex charts using the High Probability & Divergence trading methods from my books, I have identified a new trade setup this morning. As usual, you can read my notes on the chart for my thoughts on this setup. The trade being a XAG/USD Sell. Enjoy the day all. Cheers. Jim

XAG/USD...4h pairMY analysis presents a solid trade plan for XAGUSD based on technical indicators. A few additional considerations:
1️⃣ For the short setup:
A break below 33.85 aligns with momentum weakening, but watch for fakeouts, especially if volume is low.
The 32.00 target is ambitious, so partial profits around 33.00 could be wise.
2️⃣ For the long setup:
If price rebounds from 34.60, confirmation with bullish candlesticks or an RSI divergence could strengthen the trade.
Watch for resistance near 34.80–35.00 before fully committing.
Would you like to add risk management tips or additional confluences?

Silver Breakdown: Rising Wedge Bearish Move Towards Target1. Chart Overview
This 4-hour (H4) chart of Silver (XAG/USD) shows a clear Rising Wedge Pattern, a bearish technical formation. The price action recently broke below the lower support trendline, confirming a downside move. Several key levels, indicators, and trading strategies can be derived from this setup.
2. Identified Chart Pattern: Rising Wedge (Bearish Reversal)
A Rising Wedge is a pattern that forms when price consolidates between two upward-sloping trendlines, with the support line rising at a steeper angle than the resistance line. This pattern is considered bearish because it signals weakening buying pressure and an impending breakdown.
Uptrend Formation: The price had been moving within a wedge, forming higher highs and higher lows.
Volume Considerations: A wedge breakout is often accompanied by increasing volume, further confirming the trend shift.
Breakout Confirmation: The price has decisively broken below the lower boundary of the wedge, indicating that sellers are taking control.
3. Key Technical Levels & Trading Strategy
Resistance Level (Rejection Zone) – $34.00 - $34.50
The upper boundary of the rising wedge acted as strong resistance.
Multiple price rejections confirm sellers' dominance in this area.
Any future retest of this level may provide a new opportunity for short entries.
Support Level (Broken & Retested) – $32.50 - $32.80
This zone previously acted as strong support, preventing price from falling lower.
Now that price has broken this support level, it could act as resistance if a retest occurs.
A confirmed rejection here will further validate the bearish outlook.
Stop Loss Placement – $34.16
A logical stop-loss placement is slightly above the previous swing high and resistance area.
If price moves above this level, it would indicate that the breakdown has failed, invalidating the bearish setup.
Bearish Target – $30.76 (Measured Move Projection)
This level is derived from the height of the rising wedge pattern projected downward.
The area around $30.76 aligns with a previous support zone, making it a reasonable target for the current breakdown.
4. Price Action & Future Expectations
Current Market Sentiment: Bearish
The break below the wedge confirms a bearish sentiment.
A slight retracement to the previous support (now resistance) around $32.80 - $33.00 is possible before further downside.
If selling pressure remains strong, Silver is likely to reach the $30.76 target in the coming sessions.
Alternative Scenario: Bullish Recovery
If the price moves back above $34.16, the bearish outlook is invalidated.
A sustained move above this level could indicate a false breakdown and may push Silver toward new highs.
5. Trading Plan Based on This Setup
🔹 Entry Strategy:
Look for a retest of the broken support zone ($32.80 - $33.00) to enter short positions.
A rejection from this level with bearish confirmation (e.g., a bearish engulfing candle) strengthens the trade setup.
🔹 Stop Loss:
Placed above the wedge resistance at $34.16 to protect against false breakouts.
🔹 Take Profit Targets:
First Target: $31.50 (intermediate support level)
Final Target: $30.76 (measured move projection of the wedge)
6. Conclusion
This Rising Wedge Breakdown on Silver’s H4 chart presents a strong bearish trading opportunity with a well-defined risk-reward ratio. The break below key support signals continued downside, with $30.76 as the next major target. However, traders should monitor any retest of the broken support zone to confirm further selling momentum before entering new positions.


Silver H4 | Falling to an overlap SupportSilver (XAG/USD) is falling towards an overlap support and could potentially bounce off this level to climb higher.
Buy entry is at 32.007 which is an overlap support that aligns with the 23.6% Fibonacci retracement.
Stop loss is at 30.400 which is a level that lies underneath an overlap support and the 50.0% Fibonacci retracement.
Take profit is at 34.480 which is a swing-high resistance.
High Risk Investment Warning
Trading Forex/CFDs on margin carries a high level of risk and may not be suitable for all investors. Leverage can work against you.
Stratos Markets Limited (tradu.com):
CFDs are complex instruments and come with a high risk of losing money rapidly due to leverage. 63% of retail investor accounts lose money when trading CFDs with this provider. You should consider whether you understand how CFDs work and whether you can afford to take the high risk of losing your money.
Stratos Europe Ltd (tradu.com):
CFDs are complex instruments and come with a high risk of losing money rapidly due to leverage. 63% of retail investor accounts lose money when trading CFDs with this provider. You should consider whether you understand how CFDs work and whether you can afford to take the high risk of losing your money.
Stratos Global LLC (tradu.com):
Losses can exceed deposits.
Please be advised that the information presented on TradingView is provided to Tradu (‘Company’, ‘we’) by a third-party provider (‘TFA Global Pte Ltd’). Please be reminded that you are solely responsible for the trading decisions on your account. There is a very high degree of risk involved in trading. Any information and/or content is intended entirely for research, educational and informational purposes only and does not constitute investment or consultation advice or investment strategy. The information is not tailored to the investment needs of any specific person and therefore does not involve a consideration of any of the investment objectives, financial situation or needs of any viewer that may receive it. Kindly also note that past performance is not a reliable indicator of future results. Actual results may differ materially from those anticipated in forward-looking or past performance statements. We assume no liability as to the accuracy or completeness of any of the information and/or content provided herein and the Company cannot be held responsible for any omission, mistake nor for any loss or damage including without limitation to any loss of profit which may arise from reliance on any information supplied by TFA Global Pte Ltd.
The speaker(s) is neither an employee, agent nor representative of Tradu and is therefore acting independently. The opinions given are their own, constitute general market commentary, and do not constitute the opinion or advice of Tradu or any form of personal or investment advice. Tradu neither endorses nor guarantees offerings of third-party speakers, nor is Tradu responsible for the content, veracity or opinions of third-party speakers, presenters or participants.


SILVER at a CROSSROADS: Bounce or CRASH to $28?🔹 General Context
Silver has shown a strong bullish reaction from the lows around $28, later reaching a key monthly supply area between $34 and $35. However, this zone has once again been firmly rejected, leaving room for a potential deep retracement.
🟥 Key Zones
🔴 Monthly Supply Zone (34.00 - 35.00 USD): Strong resistance already tested multiple times. Candlesticks show strong rejections and long upper wicks.
🟥 Weekly Supply Zone (33.00 - 34.00 USD): Breaker block or mitigation area that triggered a strong bearish move.
⬛ Current Weekly Support Zone (32.00 - 31.90 USD): Price is currently testing this area. A new impulse could arise here — or we may witness a breakdown.
🟦 Monthly Demand Zone (28.20 - 29.20 USD): The last area defended by buyers in the mid-term. A realistic target in case of breakdown.
📊 Price Structure
The short- to medium-term trend remains bearish, with lower highs and strong rejection candles.
Current price action shows indecision, with lower wicks on recent weekly candles but smaller bullish bodies — a sign of potential accumulation... or just a pullback?
📉 RSI (Relative Strength Index)
RSI is in the neutral-high zone, not yet overbought, but in a downward phase → more room for downside if buyers don’t step in soon.
No clear divergences visible, but watch for signals on the daily timeframe.
🧭 Possible Scenarios
✅ BULLISH Scenario:
Condition: Support holds between 32.50 and 31.90 USD with a clear reversal candle.
Target: Move back toward the supply zone at 33.80 – 34.90 USD.
Confirmation: Break above 33.00 USD with increasing volume.
❌ BEARISH Scenario:
Condition: Weekly close below 31.90 USD → sign of weakness.
Target: Zone between 29.20 – 28.20 USD, a potential new institutional buy area.
Confirmation: Strong bearish break with follow-through and lack of buying reaction.
🧠 Operational Conclusion
Silver is at a critical decision point: bearish pressure from the monthly zones is evident, but as long as the 31.90/32.00 zone holds, buyers may still defend. A clean breakdown would open the door for a drop below $30.

XAGUSD H4 | Be arish Reversal Based on the H4 chart, the price is approaching our sell entry level at 32.71, a pullback resistance
Our take profit is set at 31.25, a pullback support.
The stop loss is set at 34.52, a swing high resistance.
High Risk Investment Warning
Trading Forex/CFDs on margin carries a high level of risk and may not be suitable for all investors. Leverage can work against you.
Stratos Markets Limited (tradu.com):
CFDs are complex instruments and come with a high risk of losing money rapidly due to leverage. 63% of retail investor accounts lose money when trading CFDs with this provider. You should consider whether you understand how CFDs work and whether you can afford to take the high risk of losing your money.
Stratos Europe Ltd (tradu.com):
CFDs are complex instruments and come with a high risk of losing money rapidly due to leverage. 63% of retail investor accounts lose money when trading CFDs with this provider. You should consider whether you understand how CFDs work and whether you can afford to take the high risk of losing your money.
Stratos Global LLC (tradu.com):
Losses can exceed deposits.
Please be advised that the information presented on TradingView is provided to Tradu (‘Company’, ‘we’) by a third-party provider (‘TFA Global Pte Ltd’). Please be reminded that you are solely responsible for the trading decisions on your account. There is a very high degree of risk involved in trading. Any information and/or content is intended entirely for research, educational and informational purposes only and does not constitute investment or consultation advice or investment strategy. The information is not tailored to the investment needs of any specific person and therefore does not involve a consideration of any of the investment objectives, financial situation or needs of any viewer that may receive it. Kindly also note that past performance is not a reliable indicator of future results. Actual results may differ materially from those anticipated in forward-looking or past performance statements. We assume no liability as to the accuracy or completeness of any of the information and/or content provided herein and the Company cannot be held responsible for any omission, mistake nor for any loss or damage including without limitation to any loss of profit which may arise from reliance on any information supplied by TFA Global Pte Ltd.
The speaker(s) is neither an employee, agent nor representative of Tradu and is therefore acting independently. The opinions given are their own, constitute general market commentary, and do not constitute the opinion or advice of Tradu or any form of personal or investment advice. Tradu neither endorses nor guarantees offerings of third-party speakers, nor is Tradu responsible for the content, veracity or opinions of third-party speakers, presenters or participants.

XAG/USD Climbs on FOMC WorriesSilver prices climbed above $31 per ounce on Thursday, extending gains for a second straight session as commodities rebounded following President Trump’s rollback of his reciprocal tariff policy. The new measure lowers tariffs on most trade partners to 10% for 90 days to support negotiations. However, China, a key silver consumer, still faces a steep 125% tariff, keeping geopolitical tensions elevated and sustaining safe-haven demand. Meanwhile, FOMC minutes revealed growing concerns about stagflation and the impact of Trump’s trade agenda on the Fed’s dual mandate of price stability and full employment.
Resistance starts at 31.50; if breached, the next levels are 32.15 and 33.30. Support sits at 30.20, with 29.50 and 29.20 below if that level gives way.

XAGUSD: Silver, and the latest on tariffs!Silver is trading in its ascending channel on the 4-hour timeframe, between the EMA200 and EMA50. If silver reaches the supply zone, it can be sold. A downward correction will also provide us with a buying opportunity with a good risk-reward ratio.
U.S. President Donald Trump has implemented tariff policies with the aim of revitalizing domestic manufacturing. During the 1980s, a significant portion of American manufacturing jobs either moved overseas or were replaced by automation technologies.
The shift in production was largely driven by wage disparities across countries. Nevertheless, the United States remains a leading global manufacturer, although it now focuses on producing higher-value goods. Experts argue that imposing import taxes is unlikely to achieve one of its stated goals: restoring manufacturing as a central pillar of the U.S. economy.
According to many economists, Trump’s campaign to impose tariffs on a wide range of goods from trade partners is unlikely to bring back the manufacturing jobs that once formed the backbone of the blue-collar middle class.
In the mid-20th century, the U.S. was the manufacturing capital of the world, employing more workers in this sector than any other. At its peak in the 1950s, one-fourth of the civilian workforce was engaged in manufacturing.
However, starting in the 1980s, free trade agreements facilitated the relocation of many industries abroad, while automation reduced the need for human labor in the remaining factories. Today, only about 7% of the workforce is employed in manufacturing—a figure that has remained largely unchanged since the Great Recession.
The goal of tariffs is to incentivize businesses to relocate their factories to the U.S. to avoid paying import taxes—costs that are typically passed on to consumers.
While some economists believe this approach could work for select industries, it is unlikely to recreate an era in which most household items carried the “Made in America” label.
According to a report by The Wall Street Journal, while it’s unlikely that the Chinese President will initiate a call himself, the odds of Xi Jinping responding to a call from Trump are reportedly high.
This comes amid heightened tensions between the two nations due to new tariffs and escalating trade disputes, where both sides appear to be locked in a power struggle—neither willing to be the first to back down.
Although this news may seem minor on the surface, it carries a deeper signal for the markets: despite ongoing tensions, the possibility for communication and negotiation remains. This prospect, especially in a highly volatile environment, could be seen as a positive sign by investors.
Earlier in the week, Trump had stated he was waiting for a call from Xi. Now, the Wall Street Journal suggests that if Trump initiates the conversation, a response from China is likely. While this may be an unofficial message from within the Chinese leadership, it still indicates that the door to dialogue and de-escalation is not entirely closed.


SILVER: Local Bullish Bias! Long!
My dear friends,
Today we will analyse SILVER together☺️
The market is at an inflection zone and price has now reached an area around 30.949 where previous reversals or breakouts have occurred.And a price reaction that we are seeing on multiple timeframes here could signal the next move up so we can enter on confirmation, and target the next key level of 31.206.Stop-loss is recommended beyond the inflection zone.
❤️Sending you lots of Love and Hugs❤️
