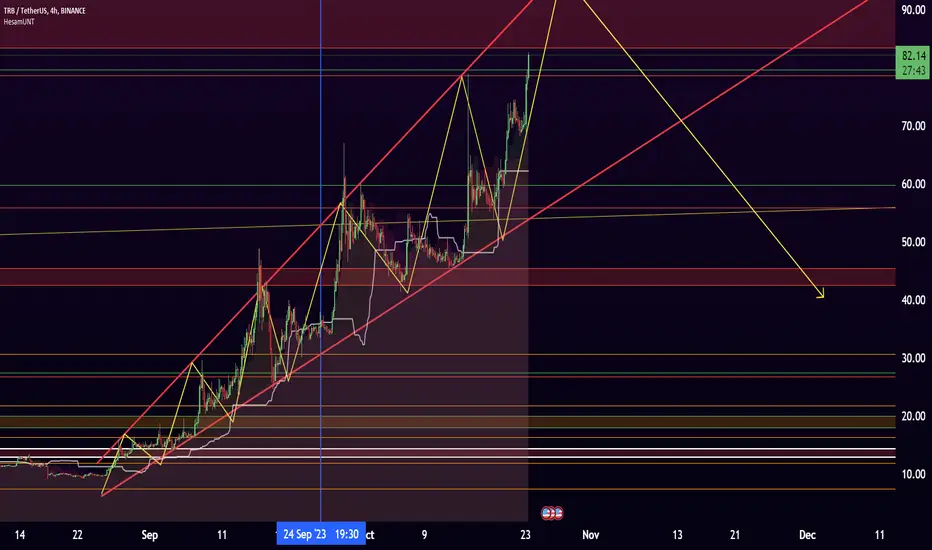
#TRBUSDT.P - MUST CORRECTION-My closer target is $85 but it musdt drop to the $75-76 band !!
good luck.
It's not investment advice...
TRBUPUSDT trade ideas

📊#TRB surges based on two bullish structures, where is the TP❓➡️We are in a strong long position in terms of the large structure. Currently, we have a double-bottom bullish structure and a smiley face bullish structure as supporting motivations. While we are strongly bullish, we also need to be wary of a sharp retracement after achieving our goals.⚠️
➡️When we reach the TP zone, the action we should take is to reduce our holdings or take profits.⚙️
🔔If you think my analysis is useful to you, please don't forget to "like" me.✔️💯💪🍻
💕 Follow me so you don't miss out on any signals and analyze 💯

#TRBUSDT.P - NEED CORRECTION I THINK ...Yes Friends, I am thinking of making two trades tonight. The first one is #TRBUSDT.P. I see it is time to correct again. Although it has not broken the trend line downwards, it is a negative mismatch for the price to pull itself up while the volume is going down. Therefore, I expect the correction decline to come in a few hours. In fact, this is for #TRBUSDT.P '' It could be a "That's enough, walk to the bottom" move. But as far as I'm concerned, it's not a big position right now.
If I summarise; I'll wave goodbye at $66.5 :)
Good luck.
None of my statements are investment advice.

TRBUSDT for Martins Fat Ass Shorts TRB LVLS for shorting, i think 130 is lvl to watch for. But still can turn around before that, so we will see what the market is gona bring us. Kind regards (peace & love & harmony)

TRBUSDT By HesamUNTHey traders
Look at TRB !!!
can u remember this move ?
TRB major player move like this
Now we can see this pattern again
Can TRB repeat the history again ?
what u think ?
Share ur chart n leave a comment
TRB-USDT// TARGET DONE ✅TRB-USDT
SPOT TRADING
buy point: 70$
sell point:87.4$
stop loss: 67.4$
profit : +23% profit done ✅


TRB - Don't Fomo!Dear my friends,
There are 4 points I want you to see for TRB. And I hope you don't have FOMO.
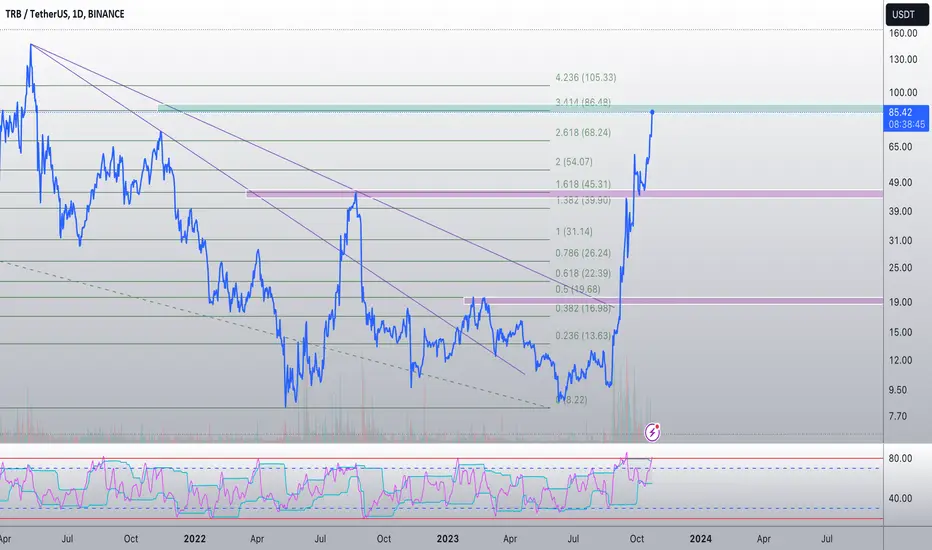
First, the RSI on the daily frame is overbought and diverging. This can also be seen on the weekly frame.
Second, Price increased but volume decreased. Purchasing power has dried up.
Third, if you look at the elliot wave, this is already wave 5.
Finally, Price has reached very strong resistance on the weekly frame.
If this is wave 1 of the big wave of the uptrend season. The price will be able to adjust to 2 areas as shown on the chart to create wave 2.
Hope this analysis will be useful to my friends.
Best Regards,
TRB has a bullish signal!
🎗#TRB/USDT 🎗
LONG
Leverage: (10.0X)
Entry Targets:
1) 81.00
2) 75.00
Take Profit Targets:
1) 84.45
2) 88.14
3) 91.13
4) 94.03
5) 97.34
6) 99.92
7) 103.38
8) 106.37
Stop Targets:
1) 70.00
🟡Chart is speaking it self!
_ _ _ _ _ _ _ _ _ _ _ _ _ _ _ _ _ _ _ _ _ _ _ _ _ _ _ _ _ _ _ _ _
Thank you for seeing idea .
Have a nice day and Good luck
🔴This is only an idea and not a financial advise ( NFA )🔴

Here I buy TellorHere I buy Tellor
I'm buying this altcoin at this level and this oracle protocol will become extreme bullish from now on.
Also, this protocol will become very good to trade on the upside from now on (if you know how to trade an altcoin)
And If you think it's too high to buy you gonna learn a lesson soon.
So let the fun begin with Tellor.
See you up there.

TRB - The mother of those who shorten will crySupporting the rise of Bitcoin, TRB continues its rapid rise. Never catch a falling knife; your buttermilk may spill and some unpleasant situations may occur :)

How-To Use Bollinger Bands Width CrossToday, this article will introduce the last member of the Bollinger Bands trio - **Bollinger Bands Width (BBW)**. This indicator is derived from the famous Bollinger Bands and is used to measure price volatility and identify trading signals.
First, let's take a look at what Bollinger Bands are. It consists of three lines that are associated with the price of a security. The middle line is usually a 20-day simple moving average (SMA), while the upper and lower bands are two standard deviations above and below the middle band. The Bollinger Bands Width is a method used to measure the width between the upper and lower bands.
```markdown
Bollinger Bands Width = (Upper Band - Lower Band) / Middle Band
```
So how do we calculate BBW? It's simple! Just subtract the lower band from the upper band and divide it by the middle band to get the BBW value.
However, it's important to note that we cannot simply determine whether it is in a narrow or wide state based on the BBW value alone. Different tools or securities may have different definitions of narrowness, and it can also change over different time ranges. Therefore, to accurately assess the importance of band narrowing, we need to analyze the past BBW fluctuations and price performance together.
Next, let's talk about one of the most famous theories about Bollinger Bands - the "squeeze". The squeeze setup consists of two steps: first, a period of low volatility where the bands narrow and prices move relatively horizontally; then, an increase in volatility where prices break above the upper band or below the lower band, signaling the start of a new trend.
In a squeeze setup during a bull market, BBW decreases, and when prices break above the upper band, a new uptrend begins. In a squeeze setup during a bear market, BBW also decreases, and when prices fall below the lower band, a new downtrend begins.
To summarize, Bollinger Bands Width (BBW) is a very useful technical analysis tool that performs well in identifying squeezes. However, traders should use it with caution! Sometimes, even though a squeeze setup occurs, a strong market trend may not actually emerge. Therefore, determining whether a breakout is valid still requires traders to decide for themselves.
Finally, let's introduce some parameters and options: Length represents the time period used for calculating the base SMA, with a default of 20 days; Source represents the determination of the data used for each candlestick in the calculation, with a default of the closing price; Standard Deviation represents the number of standard deviations away from the SMA that the upper and lower bands are, with a default of 2.


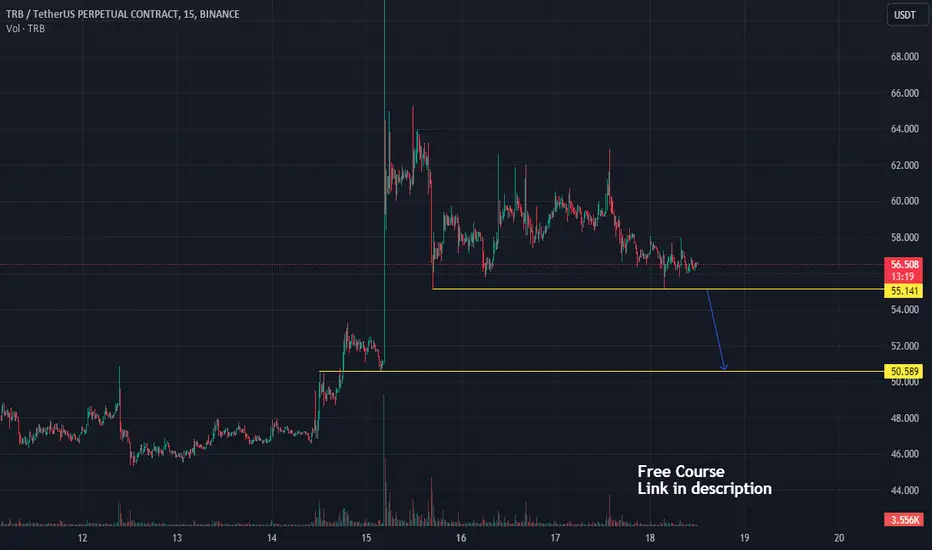
#TRBUSDT.P - TIME TO CORRECTION !!hello mates.
I came with a sweet Scalp transaction this evening :) We seem to have a correction in #trbusdt.p up to $59.5-58 levels.
Good Luck ...
Not investment advice!!!

TRB's Volume and Price Divergence. It seems like the volume does not agree with the price being uplifted. The whales have already bought this coin. The RSI Seems in Overbought region. It warns of potential dump after it reaches its recent high

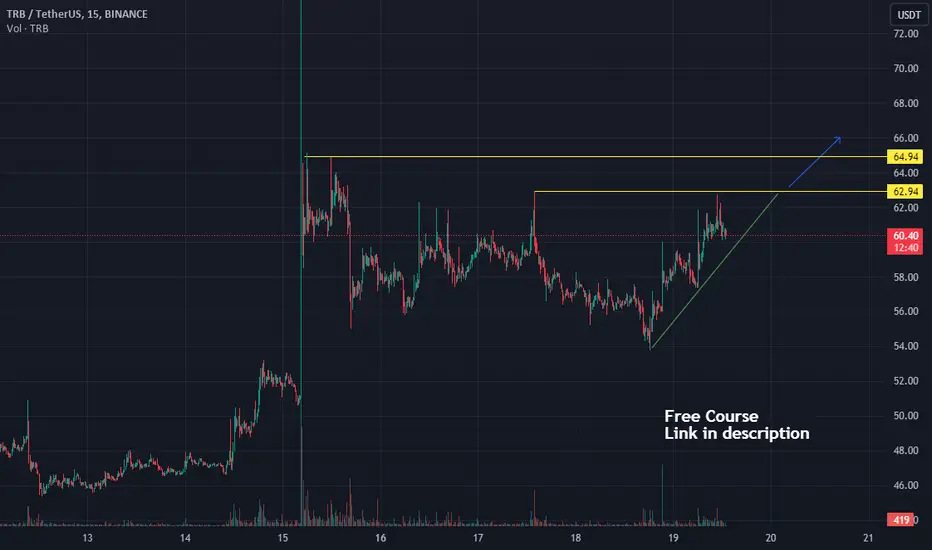
new target for TRBUSDT is 80like in the past we seen always a new high since the bitcoin up trend startet at sept. 11
so looking forward to exit TRBUSDT above 80
and re-entry on pullback to fair value gap

TRBUSDT(Tellor) Daily tf Range Updated till 19-10-23TRBUSDT(Tellor) Daily timeframe range. slowly retracing up even on this dull day. at 67.76 it failed twice, there are not much of hold up there if retail interest comes. if not than back to lower levels.

TRB Finished The Retracement. We Try A Buy Trade. Welcome to our crypto exploration hub! We're here to navigate the exciting world of digital assets, providing you with comprehensive insights into market dynamics and potential trading opportunities.Our mission is to decode the crypto market's mysteries and equip you with the knowledge you need to make informed investment choices. From the latest developments in Bitcoin to the hidden potential of various altcoins, we're your trusted source for daily technical analysis.While technical analysis is a valuable tool, it's important to remember that it's just one piece of the puzzle. We encourage you to take a well-rounded approach to your investments, considering factors like macroeconomic trends, news, and community sentiment.Join us for the freshest analyses, and don't hesitate to join the conversation in the comments below. Keep in mind that our content is purely for educational purposes and should not be construed as financial advice. Always integrate it into your broader investment strategy."

TRB has strong resistance levelThe coin in the "game" formed a level with two approaches, I consider the situation for an impulse breakdown in long after the formation of consolidation near the level, earlier in the history the instrument broke through such formations well, also a participant appears on the spot who pushes the price with densities, entering the breakdown on the activity in the glass and depositing into the level.
TRB going downThe coin in the game has formed a level with two touches, I am considering the situation for an impulse breakdown in the short after the formation of a trade, entering the breakdown on the activity in the glass and depositing in the level, the goal is to pick up the first pulse
Short opportunity 1 hour chartShort opportunity 1 hour chart
did make a resistance and probably we short. Waiting for a breakout and a retest.

TRB and triangleCoin in the game, increased activity in the glass, there is an increased volume. The instrument has formed a trend of impulse short exits to break through the support line. At the moment, an uptrend has been formed near which the price is consolidating, potentially I expect a short movement to update the local minimum of $ 54
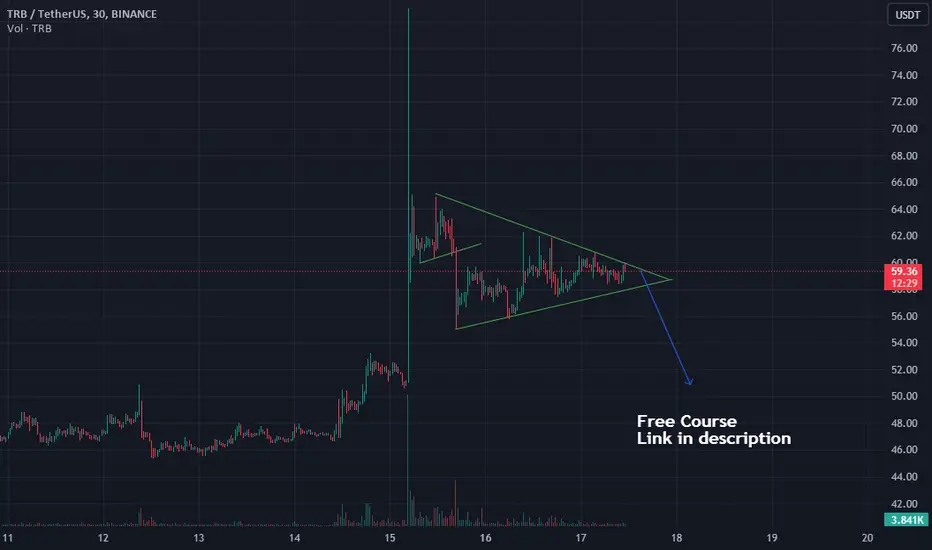
TRB SHORT Signal Free of CostBINANCE:TRBUSDT
i am opening short position at $59 & hold till $45 my Stop loss is $85
maxRECORDS future & Spot trading signal provider is a service that uses technical analysis and market research to provide recommendations and predictions on the future price movements of cryptocurrencies in futures markets. we provide typically analyze market trends, price patterns, and other relevant indicators to identify potential opportunities for profit.
