TRBUPUSDT trade ideas

TRB/USDT 1h #TRB/USDT 1h (Short Call) Chart with downwards trend
Tellor/#USDT on 1h chart there is a Bearish pattern (Rising Wedge)
Targets on the chart. If this channel got broke, Targets will come true. Stop-Loss at $37
Follow for more!
Twitter : @GodsGraphics

TRB crawling out of the basement. Bottom In? $35 the key levelTRB is fighting a key resistance zone around $35.
Major Golden fib (thick 1.618) plus local golden 6.853.
Break and successful retest would confirm "Bottom In".
Plotted are 3 different fib series from different timeframes.
Thick lines are from very high tf so they have the most "gravity".
Red lines are from last wave down, thin gold+blue of last wave up.
.
I do not use "Fibs" in the "traditional" manner (retracements).
I use Fibs to plot "Ripples" (extensions) created by "Impulses".
Then look for "Confluences" to map the "interference Pattern".
My TV collection of ideas detailing the Concepts:
Chapter 1: Introduction and numerous Examples
Chapter 2: Detailed views and Wave Analysis
Chapter 3: The Dreaded 9.618: Murderer of Moves
Chapter 4: Impulse Redux: Return to Birth place
Chapter 5: Golden Growth: Parabolic Expansions
Chapter 6: Give me a ping Vasili: 'one' Ping only
Chapter 7: The Mighty 2.618: like a Rook in Chess
.


TRB/USDT By CryptoTradersWW TRB came to 0.618 which is a good entry zone. Here I drew my opinion about TRB along with targets and a stop loss.
Targets are: 39.20$ - 42.00$ - 51.20$ - 66.00$
Stop loss daily closure below 27.00$


Tellor (TRB) formed bullish Cypher for upto 161% big moveHi dear friends, hope you are well and welcome to the new trade setup of Tellor ( TRB ) token.
Previously we had a nice trade of TRB:
Now on weekly time frame TRB formed bullish Cypher pattern.

iHs break? watchingBounce off PP 0.5?
Confirmation of neckline break
Quick 10% scalp into block of WEEKLY OPEN and MONDAY HIGH
could potentially push through also

TrbusdtTRB/USDT Lying on strong support.Stochastic is giving a buying signal. It will bounce hard from here 😊🚀
Targets: $35- 42 - 51 - 60

TRBUsdtTellor is good position for buy
but ranking is not good little risky but have chanse going too 150$
WEB3 is future and project on web 3 good for save but remembe rnot more money use on this
rank #496 CMC
Tellor on Polygon blockchain run and oracle project.
GL
EntryPoint:
32.56
Supports:
26.36
19.47
16.70
Resistance:
41.03
Targets:
52.93
65.01
79.85
106.95
155.30
For HODL :
249.18
319.25
455.40
better HODL save for years
GL


#TRBUSDT #TellorWith the defeat of 39.51 resistance, it can reach 45.85 to 50.60.
Support 1: 36.84
Support 2: 33.56
Resistance 1: 39.51
Resistance 2: 45.85
Resistance 3: 50.60

TRB/USDT LongTRB/USDT Long
Curently trading at 55$
Dip towards 55$-51$ will be buying opportunity
Can start acculumulation at dips of the given area
Stay Long above 47.8$
Targets are define on chart, most probably 80$-85$
#TRB#Long#ALISAQIB


TRB/USDT swing trade opportunity A very good opportunity but wait after the day close to make sure it doesn’t go down below the blue line and have a sell order at the first green line. If you want longer term the rest of the goals are in front of you

Too many RESISTANCE LEVELSI'm not yet bullish on TRB until it clears all these Resistance levels. However, I'm still strongly expecting a rough ride up to $100 or more. Not a financial advice, always do your research.

TRBUSDTIf TRBUSDT BREAK 60$ and stays over it the pattern will be confirmed and will see 70$ as the main Target. Wait for the confirmation
The chart is 1H
Good luck


TRB/USDT LONGIf Bitcoin is supported in the support range of 57 and 58, trb can be supported in the first support area .
And if Bitcoin fails to maintain 57 support. In the second support area, you can buy your second order.
pls like and share

ALMOST READY TO PUMPTRBUSDT IS ALMOST READY TO PUMP
As I draw a support and resistance zone, It could be break and touch the tp1 and tp2

TRBUSDT is creating a pennant 🦐TRBUSDT is creating a pennant below the weekly resistance. IF the price is going to have a breakout from the pennant and flip the current resistance into new support, According to Plancton's strategy (check our Academy ), we can set a nice order
–––––
Follow the Shrimp 🦐
Keep in mind.
🟣 Purple structure -> Monthly structure.
🔴 Red structure -> Weekly structure.
🔵 Blue structure -> Daily structure.
🟡 Yellow structure -> 4h structure.
⚫️ Black structure -> <4h structure.
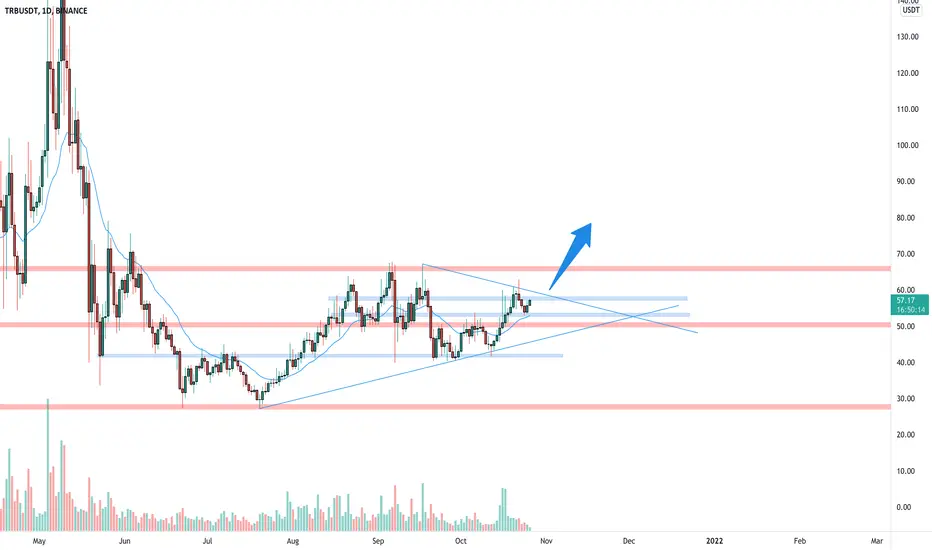
TRB - In the breakout rangeTRBUSDT :
The price is moving in one channel.
As can be seen in the chart, prices have repeatedly encountered and reacted to this trend.
That all leads to a price drop.
If this trend is broken, we expect a good move.
If the price breaks the trend line of the first target, we will probably have a good price jump.
But :
The buy signal has not been seen, yet.
The trend line has not been broken, yet.
Bitcoin movements at this time may affect its movement.
Then :
You can monitor this coin and put it in your watchlist.

