⬆️ TRB WILL JUMP! 🏃My opinion is TRB is undervalued and on strong support. it will continue toward 72$ and then 100$. 🆙🤸♀️
TRBUPUSDT trade ideas

TRB is Looking for 100 !Tellor supported very good lately, we should looking for a pump to 70 level in the week ahead.
It creates a strong bullish trendline, so if the 51$ triggered by buyers we can buy some TRB at the pullback for 72$ target.


TRBUSDTHello to you all. Mars Signals team wishes you high profits at all times.
We are in time frame 4 hours a day. . As you can see, the price is moving within an uptrend channel. We intend to enter the trade after breaking the resistance line for the above goal. But if the price penetrates below the support line, we consider the fall.
Warning: This is just a suggestion to you and we do not guarantee profits.
Wish you luck!

TRBUSDTToday TRB will hit its first target $52. Then we could have a short fall after which the price might hit $56.5 too.
Good luck!

TRBUSDT - Long - Potential 31.08%TRBUSDT - Long - Potential 31.08%
Exchanges: Binance, Huobi.pro
Signal Type: Regular (Long)
Entry Zone:
37.037 - 40.347
Take-Profit Targets:
1) 42.747
2) 48.837
3) 52.996
Stop Targets:
1) 33.211
Trailing Configuration:
Entry: Percentage (0.0%)

TRBUSDT LONGSame set up like AVAX and CRV. Breakout of the descending trendline, and the resistance, supported with volume expansion and forming ascending triangle. Trade wisely and keep an eye on BTC, it has the decision to make us enjoy the party. lol

TRB|USDT🌙Hey hey my friends 👋
TRB looks like it should start to rocket soon, look at all that volume 😊

Are yo ready?Get ready to become rich, folks🔥
There is one more interesting formation on crypto market.
Symmetrical triangle on TRB crypto pair.
According to Elliott Waves theory Wave D is done and now price is heading to Wave E.
However this formation may become circumcised and break the level earlier.
So follow the chart and look for the breakout carefully.
_____________________________________________________
If you enjoy my FREE Analysis , support the idea with a big LIKE👍 and don't forget to SUBSCRIBE my channel, you won't miss anything!
Feel free to leave comments✉️
And always remember: "we don't predict, we react".


TRB Exemple of possible bottom, unlike TomoUSDTHi,
Here is an example of a potential bottom on 4H, up to 12H time frame, for TRBUSDT. The daily candle is currently not closed yet.
On the 12H, we can see a candle with a relative big wick at the bottom, like on the 22.06.2021 at 14h00.
On the 12H RSI has make some bullish Div, and Stochastic as crossed to the upside from a low level. It's look like bullish to me.
Bullish Div detected the 19th of jully at 14h00 on 4H :
With a Bullish div confirmed yesterday 19th of jully at 14h00, on the 1H time frame, and with a bearish trend line broken today at 09h00, re-tested a little bit bellow at 11h00
There is a bigger down trend line on the 4H. if this trend line is also broken, than the target can be higher.
I'm just not sure yet of the potential target. If TRB can go to the top of the 4H-12H range at arround 41-42, or not.
Have a nice day to every body.
Regards


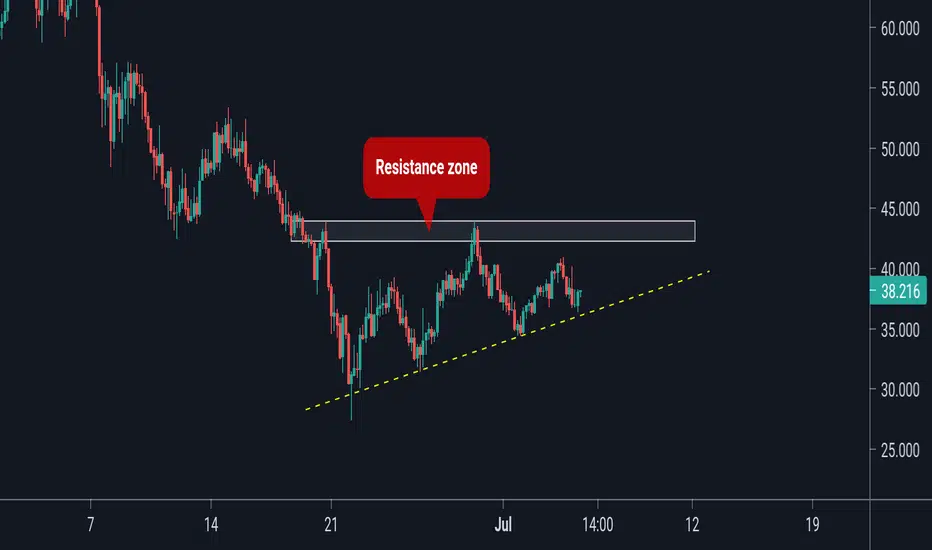
Watch for breakout or for bounceTRB in range and in a symmetrical triangle, you could enter on the breakout from triangle but safer on some of the levels break or bounce ...


TRB Ascending TriangleTRB / USDT
Ascending Triangle
I will be bullish after break and hold above the upper resistance
Best of luck


TRB/USDT Long Short-Term TradeIndicators
4H & 1H RSI shows that TRB/USDT is looking to break 50s level after ending a small bearish pattern three days ago as graph shows strong support in that area.
MA CROSS (50,100) lines are about to confirm a bullish cross after almost three weeks in 4h & in the 1H chart bullish cross is just running but facing sideways daily crosses.
ADX (4H) on DMI below 20 which often indicates "non-existent trend" and reached a line resistance between 14-15 points, bearish for now. DMI+ (4H) battling trend reversal with DMI- with no trend power from ADX.
Pattern
(4H) Measured Move Up (1H, 30 min) Bullish Symmetrical Triangle Break
Conclusion
Conclusion
Trade set up based on short term support @38.00 as well as a 12-day bullish trend. Price just bull broke the triangle pattern and confirmed by bouncing off midterm bearish trend line. As it holds up, target is to find profit off this breakout of the overall bearish momentum in the crypto market. Profit targets were set up based on the Long Position tool upon the already marked support and resistance prices. Entry Level must be from a lower price range to gain short term RSI strength to then proceed to first target just discussed. The four profit targets shall go to 7% while max downside is 3%.

TRBUSDT - Long - Potential 51.20%TRBUSDT - Long - Potential 51.20%
Exchanges: Binance, Huobi.pro
Signal Type: Regular (Long)
Entry Zone:
31.562 - 35.0825
Take-Profit Targets:
1) 37.324
2) 42.345
3) 53.046
Stop Targets:
1) 27.199
Entry Triggers- Big reversal incoming, RSI signalling a buy here.
