Trb on support looking good for thr bullish movement Trb is on it's support,we can see a bullish movement soon.The setup will be invalid once it broke 79.50
TRBUPUSDT trade ideas

Trb/usdt Breakout TRB/USDT is showing a breakout pattern on the 8-hour time frame, suggesting a potential significant bullish movement in the near future. This information is for educational purposes only and should not be considered financial advice. It is recommended to conduct your own research (DYOR) before executing any trading actions.

Trb might explode abc pattern + channel + bullish pennant
wish you luck!
not financial advice
i'm just learning and publishing my journey 🤍 🧡 🖤

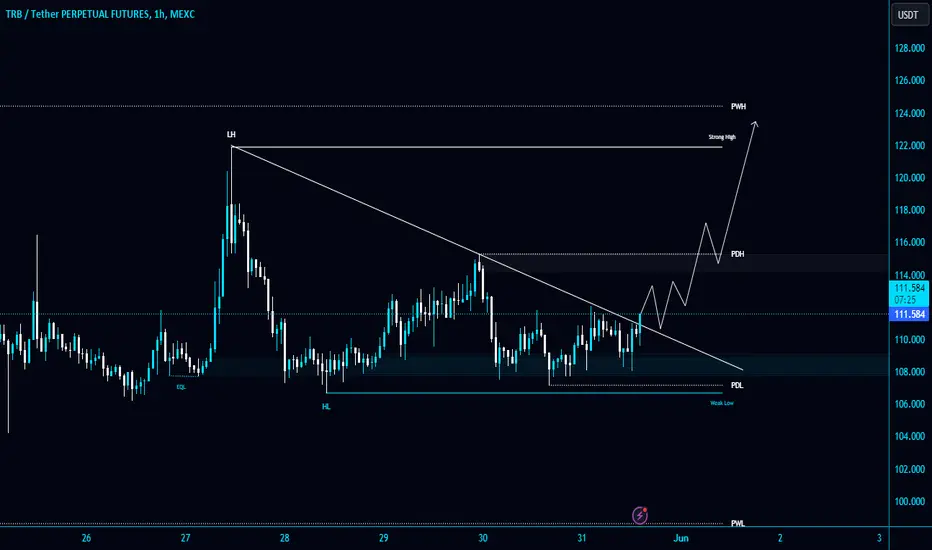
#TRB/USDT is breaking the Diagonal Trendline in 4-Hour TF!#TRB/USDT is breaking the Diagonal Trendline in 4-Hour TF!
Please wait for a successful breakout and retest to long it. The local support level is $107.2.
#TRB/USDT#TRB
We have a bearish channel pattern on a 4-hour frame, the price moves within it and adheres to its limits well
We have a green support area at the price of 100 after the price touched it and bounced from it
We have a tendency to stabilize above moving average 100
We have a downtrend on the RSI indicator that supports the price higher with a breakout
Entry price is 108.00
The first target is 122.00
The second goal is 134.00
the third goal is 145.24

TRBUSDT 12HBullish pennant on the #TRB 12H time frame chart. $200 is programmed. Wait for the breakout of the pennant and MA50, then enter to this coin. Targets are:
$122.90
$137.68
$149.63
$161.57
$178.58
$200.25

TRBUSDT- bottom out here? Stay sharp.#TRBUSDT.. if you read my previous analysis about TRBUSDT then you can realized that trbusdt still holding my levels actually.
And now again it's going to bottom here if market hold 105 that is you swing atea now in weekly and daily chart as well.
Don't be lazy here.
Good luck
Trade wisely

TRB LongWe have only one job here and that's to fill up...this is quite strategic and if TRUe massive ..
Limit is the game changer, trade with LIMIT but make sure to check back for results

TRB/USDT LONG TRADE SETUPA long trade setup of TRB/USDT also can be taken for SPOT HODL with max of 57% can be achieved in the chart.
'DYOR' before entering the trade or investing any amount.

Short Analysis on TRB: Potential Drop Aheadsell TRB Target: 77
The current technical analysis suggests a bearish outlook for TRB, indicating a potential drop to the target price of 77.
selling TRB at current levels, aiming for the target price of 77. Always remember to set appropriate stop-loss orders to manage risk effectively.
Feel free to adjust the analysis according to the latest market conditions and your trading strategy.

$TRB Scalp TradeTRB has grabbed the liquidity now it is time for it to give a pump for shorters' liquidity.
Buy before it flies.
Do follow if you like the signal and take advantage of it :).

TRB/USDT It shows the chart will be breakout of the descending!💎 Paradisers, #TRB is indeed a coin worth monitoring closely.
💎 It's currently moving within a descending channel pattern, and the price has successfully bounced when hitting the bottom of the channel (BOS area).
💎 There's potential for the price to test the resistance trendline of the descending channel in an attempt to break out of the pattern. If this breakout is successful, it could signal a bullish momentum for TRB, potentially leading to significant upward movement.
💎 To confirm the bullish trend, TRB would need to break above the CHoch area around the $127 level. This would provide additional confirmation that the trend has shifted back to bullish, increasing the likelihood of reaching our target strong resistance area.
💎 However, if TRB fails to break out of the descending channel and experiences a strong rejection when testing the trendline, it's possible that the price will resume its downward trajectory. A confirmation of this downward continuation would occur if TRB breaks below the BOS area at 108.8. In such a scenario, TRB could revisit the demand area around 88.4.
💎 It's important for TRB to bounce from the demand area to attempt another breakout of the descending channel. If TRB fails to bounce and breaks down below the demand area, it would confirm a bearish invalidation, indicating further downward movement for the price.
MyCryptoParadise
iFeel the success🌴

My analysis of the future movement of the currency pair TRB USDHello, dear friends and TRADERS.
My analysis of the future movement of the currency pair trb usdt in the daily time frame is as follows.
The currency TRB USDT is forming a rectangular pattern in the daily time frame, and the bottom of this pattern is $90. And the next target is likely to be $130AND 145 $ in the future. And maybe it is better

TRBUSDTSpeak little Do more...
the liquidity in upper zone is calling price
this is nopt a trading advice...this is just my idea...so please be careful

TRB/USDTThe bearish AB=CD pattern is a harmonic price pattern used to identify potential market reversals. It consists of four points (A, B, C, and D) and two equal-length legs (AB and CD) that form a specific geometric structure. Here’s a brief overview:
Structure of the Bearish AB=CD Pattern
1. **AB Move**: An upward price movement from point A to point B.
2. **BC Retracement**: A downward retracement from point B to point C, typically 61.8% to 78.6% of the AB move.
3. **CD Move**: An upward move from point C to point D, equal in length to the AB move.
Key Characteristics
- **AB = CD**: The AB and CD legs should be of equal length.
- **BC Retracement**: Should be between 61.8% and 78.6% of the AB move.
- **CD Extension**: Often 127.2% or 161.8% of the BC leg.
Trading the Bearish AB=CD Pattern
1. **Entry Point**: Enter a short position near the completion of the CD leg (point D).
2. **Stop Loss**: Place a stop loss just above point D.
3. **Target**: Set initial profit targets at 38.2% or 61.8% retracement levels of the CD leg.
This pattern helps traders anticipate reversals, allowing them to make informed trading decisions. Proper risk management is crucial when using this strategy.

TRBUSDT is BullishTRB was in a declining phase, printing lower highs and lower lows. After that it went into an accumulation phase, which was soon followed by a breakout confirmed by the break of previous lower high. It has printed a higher high and after retracement to 0.382 of fib level, it is now looking good for next rally. According to AB = CD also the target is around 180. Moreover, Entry point along with TP's and SL is mentioned on the chart.

TRB (Getting Ready for the New ATH Journey)TRB/USDT on low time frames...
the target is $200
the stoploss is <$104

TRB SHORT Considering that we had two collisions at the support
Considering that we had two collisions at the support point. We expect it to go back down again.

TRB/USDTIt seems you might have meant "Bullish Divergence." In technical analysis, bullish divergence is a phenomenon observed on a price chart when the price of an asset moves lower, but an oscillator or momentum indicator forms higher lows. It suggests that while the price is showing weakness and continuing its downtrend, the momentum behind the downward movement is decreasing, which could signal a potential reversal to the upside.
Here's how bullish divergence typically manifests:
1. **Price Movement**: The price of the asset forms lower lows, indicating a downtrend.
2. **Indicator Movement**: Simultaneously, the corresponding oscillator or momentum indicator (such as the Relative Strength Index - RSI, Moving Average Convergence Divergence - MACD, or Stochastic Oscillator) forms higher lows.
This discrepancy between price action and indicator movement suggests that the selling pressure is weakening, even though the price continues to decline. It may indicate that buyers are starting to gain control and that a reversal to the upside could be imminent.
Traders often use bullish divergence as a potential buying signal. However, it's crucial to wait for confirmation, such as a bullish reversal candlestick pattern or a breakout above a key resistance level, before entering a long position. Additionally, combining bullish divergence with other technical analysis tools and factors can improve the reliability of the signal.

Tellor $97 Will this be as promising as Chainlinkiv missed the Oracle King Chainlink
maybe this can be as rewarding in a year or two
im looking at MIL:1K as conservative valuation with around GETTEX:2BN
relative to Links peak @ $21bn
who knows this next wave of Ai and Oracle may jst be Tellors moment

LONG #TRBUSDTLONG #TRBUSDT from $141
30m TF. The instrument has been actively growing at increased volumes over the past few days and has currently formed an ascending triangle formation, indicating a possible continuation of the trend. Buyers are pushing the price lows along the trend line to the resistance levels, behind which unrealized liquidity has accumulated.
I will consider a small consolidation near them and an impulse movement on the activity in the glass.

#TRB/USDT#TRB
The price is moving in a bearish flag channel on a 12-hour frame and we have a support area in green at the level of the lower border of the channel at the price of $80.
We have a trend to rise above the Moving Average 100
The RSI indicator has a downtrend that is about to break higher
Entry price 87
First goal 98
The second goal is 113.50
Third goal 151

TRBUSDT → Trend change, buyers provoke growth. 150.0?BINANCE:TRBUSDT finds its buyer. A breakthrough of the downtrend resistance is formed and the accumulated potential is realized. The probable target may become the area of 150-160.
The retest of the bottom forms a strong enough medium-term reversal pattern - double bottom. A buyer appears on the market, which is generally seen in candlestick patterns and price movement on the background of volume growth. The price breaks the resistance of 99.3 and enters the local range where it can form consolidation. There is a high probability of catching a retest of support before further breaking 110.0 and rising to the previously mentioned targets.
Support levels: 99.32, 89.75
Resistance levels: 110.0, 126
Technically, the coin has an interesting potential, the realization of which may continue with the breakout of 110.0.
Regards R. Linda!
