How a professional trader analyzes an oscillator chart that workI analyzed the #TRB/USDT coin today, May 9th, with composure and elegance. Let's discuss the price movement with only a few Fibonacci variables and the GF1 Quantum indicator. We can observe that the asset broke a 17-day range on May 1st, 2024, in addition to forming a double bottom, confirming institutional presence defending the $44 price level. This indicates institutional interest from significant players. Following the breakout, we saw three Elliott wave expansions, currently in the third wave, possibly heading towards a fourth corrective wave before initiating another impulsive wave, which would be the fifth on the 15-minute timeframe. Currently, it is within a range where buying and selling are allowed, favoring the uptrend of this timeframe. Buy at $114, the range's base, and sell at $142, the range's high. We also anticipate price consolidation for approximately 160 candles based on previous periods and forecast technique, defining an important zone to break on May 10th, potentially leading to fakeouts and more purchases between $100 and $114, with $90 being a gift and $71 being excellent. Implement DCA and capitalize on the uptrend. Note that liquidity will first be generated at daily and monthly maxima zones around $149, heading towards the boss zone of the quantum indicator at $180, potentially testing the annual opening at $200 and higher levels. According to our GF1 Quantum indicator, the correlation over the last 8 days is below 50% for BTC and 61.5% for dominance, suggesting that BTC dominance currently has more influence on the TRB asset. Therefore, if you desire real-time future predictions, observe Bitcoin dominance according to our GF1 Ultra indicator board to anticipate next steps. Based on my analysis, we may experience a short-term correction, but the preference is for purchases as it is at the base of the range. Work the range: if it breaks above the range's maximum, buy; if there's a fakeout, sell and wait for a valid breakout. Work with these levels to enter at the ideal moment without turning it into a gamble. After all, you want significant profits and volatility at the right moment.More information read the chart.
Disclaimer: Before proceeding, please note that the following information is based on technical analysis and should not be construed as investment advice. Always conduct your own research and, if necessary, seek advice from a financial professional.
TRBUPUSDT trade ideas

$TRB to Reach $300 MarkTRB was the token of the new year, as it recorded gains of the best run for the last part of the year, LSE:TRB started at around $16 on September 1st, 2023 and peaked on December 31st, 2023 at a record price of $630 per coin.
With the reclaim of market structure, LSE:TRB is billed to move to at least $300 per coin and this is simply putting it as a conservative estimate because it is a token backed by the good players in the industry.

TRB/USDT Long Position to The Moon!TRB/USDT has witnessed a staggering 240% price hike over the last week. But can we expect it to skyrocket further?

TRB AnalysisTRB Analysis
TRB has completed an impulsive wave up and is showing a rejection at the 61.8% retracement of the past high and the 2.382 Fibonacci extension. I am looking for a short term correction. There is Fibonacci confluence around $116-$118. I would expect this overall uptrend to continue towards at least $162. This set up will fail below $106.

TRB USDT LONG PhemexTRB Has formed a Double Bottom on the 1HR timeframe. 3 targets have been Listed.

Trbusdt ,,, Tecnicall analyst Turbo is in the upward phase of its trend, and there is still room to reach the goals, based on the support and resistance points, the upward phase of Turbo can be well observed in the daily time.

TRBUSDT - where is top for today? holding or not??#TRB/USDT... what a move it was guys, and market placed your targeted area as i told you .
now market at his today most important area that is 136 around
keep close that area because if market hold it then again drop expected from here,
don't be panic here,
good luck
trade wisely

TRBUSDT - at his do or die area, holding or not??#GOLD... A very wild bounce from 45 around,
And now market at his swing area 113.30
It was market most important area in history before drop to 45 and it's market swing now again.
Keep close 113.30
Next move to anyside will start from here,
Don't be panic and only keep close 113.30
Good luck
Trade wisely

TRB - Short squeeze loadingSpotted a nice setup on TRB, it is down more than 90% as we speak and printed a nice bullish divergence on the daily with a double-bottom structure right on HTF support. This is the most ideal setup you could ask for.
Think we will see a violent push coming days, probably +100% within a few days, given the thin order books. No need for leverage here, just enjoy the ride.
Stay safe!

TRB / USDT Short PositionAfter 3 Days of Strong price increase
Pressure on RSI level ,
reaching to neckline needs to have some rest on Fibo236

#TRB/USDT pumps like crazy and currently at PMH $97 resistance l#TRB/USDT pumps like crazy and currently at PMH $97 resistance level in 30-Minut TF!
Let's wait for breakdown confirmation to short $TRB. So far, it is consolidating. If it break above the resistance and hold it as a support I will long this Ponzi.

TRBUSDT.1DAnalyzing the daily chart for TRB/USDT, I'm observing several key technical indicators and price patterns that guide my trading strategy. Firstly, the price action shows a declining trend from earlier highs, followed by stabilization and a potential reversal pattern forming in the recent sessions.
Resistance and Support Levels:
Resistance 1 (R1): $103.99 - This level was previously tested, showing significant sell pressure. It is a crucial barrier for any bullish momentum.
Resistance 2 (R2): $123.66 - A longer-term target that would require substantial buying volume and positive market sentiment to reach.
Support 1 (S1): The chart does not clearly state the value, but it is lower, possibly around the most recent lows.
Trend Analysis:
The descending trend line highlighted in green shows the ongoing bearish pressure. However, the recent break above this line could indicate a change in sentiment if the price can sustain above this breakout level.
Technical Indicators:
Relative Strength Index (RSI): Currently at 68.7, approaching the overbought territory. This suggests that the market may be gaining bullish momentum, but also warns of potential pullbacks if it crosses above 70.
Moving Average Convergence Divergence (MACD): The MACD line (blue) above the signal line (orange)
and a positive histogram value indicate bullish momentum. The widening gap between the MACD and the signal line further supports the bullish outlook.
Candlestick Patterns:
The recent candlesticks show increased buying activity. The breakout candle that pierced the descending trend line is particularly significant, supported by higher trading volume, which often signifies strength in the move.
Conclusion:
Based on the current setup, the market shows signs of a potential reversal from its previous downtrend. Key strategies would involve watching for a stable hold above the descending trend line and targeting the first resistance at $103.99. Any trades should be vigilant of the RSI nearing overbought conditions, which might lead to a retracement. Setting stop losses just below the recent swing low could be prudent to manage risk. If the momentum continues and the market breaks above R1, the next target would be R2 at $123.66, provided that market conditions support further gains.

TRB Swing Long#TRB
Swing Long Trade
Market entry
Also set a limit order at 56.44
Please, before taking this trade follow your RM. Especially calculate your loss, since the SL gonna be a bit far.
Targets are:
86
108
136
168 - can go even higher, if manages to break above 168 price level
SL
43.88

Tellor (TRB) completed a setup for upto 9.50% pumpHi dear members, hope you are well and welcome to the new trade setup of Tellor (TRB) token with US Dollar pair.
Previously we caught almost 113% pump of TRB as below:
Now on 1-hr time frame, TRB has formed a bullish AB=CD move for the next price reversal.
Note: Above idea is for educational purpose only. It is advised to diversify and strictly follow the stop loss, and don't get stuck with trade.

LONG #TRBUSDT ⬆️ $82LONG #TRBUSDT from $72 stop loss $66
15m TF. Yesterday, the instrument showed an increase of more than 70%, we continue to be in an upward movement structure, trading volumes, as we see, have increased very much, activity from the buyer continues to be increased, from above the price leaves behind levels and even hays, which retain unrealized liquidity, the withdrawal of which I will consider, at the current form a local triangle on the lower TF breakdown of which will be my TVX, the nearest hourly imbalance has been blocked from below, I expect to see a continuation of the long with the potential to move to the $ 82 mark

trb long or short everything on charttrb long down trend break out done let see if it holds breakout trend line as a support we can short it from the area mention

TRB superbAfter good buy prints and aggressive FBUY prints and with great volume we had a very good run. now with the sell print we are expecting a short till 60. DYOR

TRB Short PHEMEXHow Far Will The TRB Crash Go?
When it comes to how far the crash can go, the crypto analyst sees an incredible drop in price coming.
The analyst believes that the price of Trellor (TRB) will see at least 42% crash from the current level. the analyst revealed that they had decided to start shorting the TRB coin. Targets Marked.

TRBUSDT - market is at EDGE. What's next?#TRBUSDT... market very well holding his bottom as you can see our last idea about TRBUSDT,
We were mentioned that support and market very well hold and placed around 103 105 high..
So guys thing is that we have same supporting area for now again and still valid in weekly and monthly chart..
Keep that supporting region and untill market hold that supporting region , there is no selling confirmation ..
Buy only above that region with stricted stop..
Good luck
trade wisely

Trb/Usdt Plan A potential bullish pennant pattern in the TRB/USDT pair has formed on the 4-hour timeframe. If this pattern experiences a successful breakout, there is a possibility of a substantial bullish move exceeding $100. It's important to note that this information should not be considered as financial advice, and conducting your research (DYOR - Do Your Own Research) is highly recommended.

TRBUSDT - at his today supporting area? holding?#TRBUSDT.. guys if you remembered we short trbusdt and our target was 76 and market very well placed.
so now if there is any kind of buying scnerios left then 76 is the support of the week.
keep close 76 77 because if market hold it then bounce expected from here otherwise not..
day closing below 76 means buying invalid for now.
good luck
trade wisely

TRB/USDT IDEA The TRB/USDT market structure is indicating a shift towards a bullish trend. A breakout above the trendline resistance has been confirmed, suggesting a potential 20-40% bullish move in the short term. It is important to note that this information is shared for educational purposes and is not intended as financial advice. Traders and investors are encouraged to conduct their own research and analysis before making any investment decisions in this market.

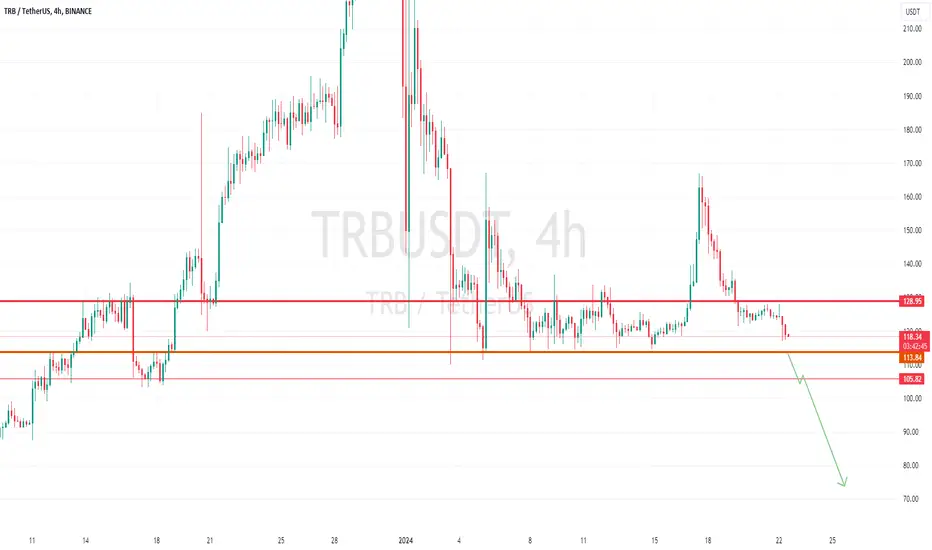
TRBUSDT.. it will hold his bottom or not??#TRBUSDT.. so guys market again at his supporting area 113 above.
that is only area that can play key role in TRBUSDT price,
keep close it because if market clear 113 then downside it will going towards 80 around,
but only below 113 keep close it and manage accordingly.
only area is 113 as major supporting area,
don't hold your buying's below that level..
trade wisely
good luck