Analisa TRXIDR Target SWING 21 November 2021Analisa TRXIDR
SWING
Resistance 1 : 1.529
Resistance 1 : 1.542
Ahad, 21 November 2021
Mas Res
HARRUMA DIGITRADE
TRXUSDT_A98D8A.USD trade ideas

TRX/USD (30MN) Bullish wave We2Hi Traders
TRX/USD (30MN Timeframe)
A HIGH probability, entry signal to go LONG will be given with the upward break of 0.1128 after the market found support at 0.1094. Only the downward break of 0.1094 would cancel the bullish scenario.
Trade details
Entry: 0.1128
Stop loss: 0.1094
Take profit 1: 0.1159
Take profit 2: 0.1199
Score: 8
Strategy: Bullish wave We2

TRX : Can we see Pending Rally to 0.17$In the last few days TRX has started gaining momentum and hit resistance at 0.13 , but together with the rest of the market it took a correction . The 0.10 area looks good support as it confluences with the 50 EMA and also our present point of Control.

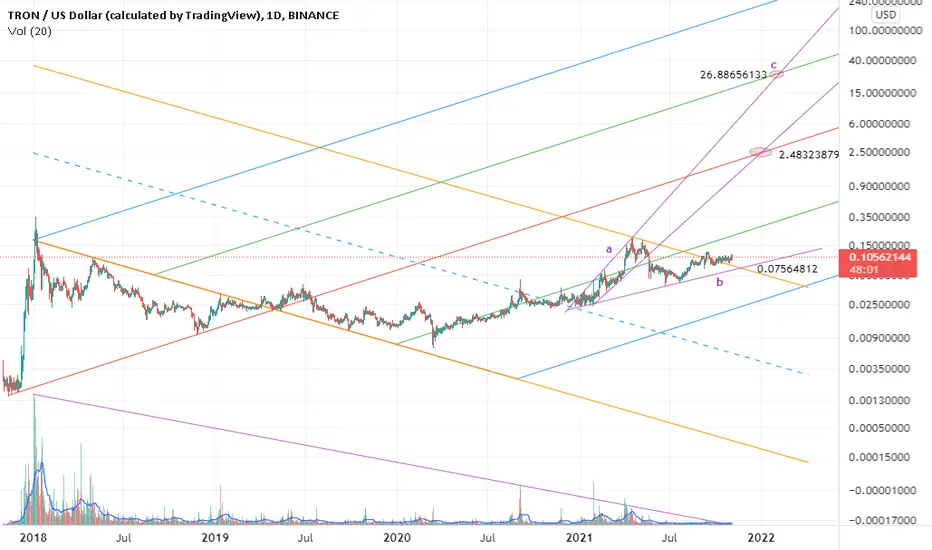
Monthly Contracting Triangle CountThis contracting triangle with reverse alternation is probably the better count compared to my last chart, both are still possible but this is my new primary count because it can also be applied to BTC, ETH, and other cryptos. It also fits better on the higher timeframes and it explains why this drop was unusually violent and out-of-the-blue, which means it's likely to get retraced completely, and when the REAL bull run begins things will get a lot more exciting than they did this last run.
This is a very bullish count, but it implies we're still in the correction which began in 2018 and we will probably drift up/sideways for the next 9 months while wave-E finishes up, and most cryptos could even hit ATH this year. After wave-E is finished, TRX will probably begin its vertical journey towards $10+ in 2022. Most cryptos will probably follow a similar pattern of drifting up for the rest of the year and then going vertical in 2022.
My guess for the catalyst is SEC v Ripple going to trial and completing in Q2 of 2022, with a favorable ruling that Ripple's marketing of XRP was legal and not under the SEC's jurisdiction. A favorable trial outcome will allow titans of crypto like Ripple, Tron, EOS, and other developers with extremely deep pockets to begin massive marketing campaigns without fear of violating US securities laws.
It also seems likely that the crypto market has already reached the bottom because wave-a of E is 61% of the price of wave-C, but I wouldn't completely rule out a trip to under 6 cents until TRX moves above 10 cents.

stay with TRX to 0.135$ hi guys
i hope you got the profit of TRX rally
in new analysis, it may touch the bottom of channel
then will go for the it's journey
good luck
plz support me
BINANCE:TRXUSD

TRX starts pumping hi guys
I see that there is a new short analysis on the my before one
as you can see, TRX has a good potential for moving upward
it will touch 0.108 $ and then start to reach 0.12 in first step
good luck
plz support me

Bearish Crab on TRXUSDWe have a spike in volume with the RSI overbought and a bearish engulfing of the terminal bar at this potential PCZ why not give it a shot.

its either completed 1,2,3,4,5 wave or is in middle of wave 4 I think it either completed bullish Elliot wave or its in middle of it .

💡Don't miss the great buy opportunity in TRXUSD @justinsuntronTrading suggestion:
". There is a possibility of temporary retracement to the suggested support line (0.1230).
. if so, traders can set orders based on Price Action and expect to reach short-term targets."
Technical analysis:
. TRXUSD is in an uptrend, and the continuation of the uptrend is expected.
. The price is above the 21-Day WEMA, which acts as a dynamic support.
. The RSI is at 69.
Take Profits:
TP1= @ 0.1299
TP2= @ 0.1361
TP3= @ 0.1415
TP4= @ 0.1482
TP5= @ 0.1557
SL= Break below S2
❤️ If you find this helpful and want more FREE forecasts in TradingView
. . . . . Please show your support back,
. . . . . . . . Hit the 👍 LIKE button,
. . . . . . . . . . Drop some feedback below in the comment!
❤️ Your support is very much 🙏 appreciated!❤️
💎 Want us to help you become a better Forex / Crypto trader?
Now, It's your turn!
Be sure to leave a comment; let us know how you see this opportunity and forecast.
Trade well, ❤️
ForecastCity English Support Team ❤️

💡Don't miss the great buy opportunity in TRXUSD @justinsuntronTrading suggestion:
". There is a possibility of temporary retracement to the suggested support line (0.1230).
. if so, traders can set orders based on Price Action and expect to reach short-term targets."
Technical analysis:
. TRXUSD is in an uptrend, and the continuation of the uptrend is expected.
. The price is above the 21-Day WEMA, which acts as a dynamic support.
. The RSI is at 69.
Take Profits:
TP1= @ 0.1299
TP2= @ 0.1361
TP3= @ 0.1415
TP4= @ 0.1482
TP5= @ 0.1557
SL= Break below S2
❤️ If you find this helpful and want more FREE forecasts in TradingView
. . . . . Please show your support back,
. . . . . . . . Hit the 👍 LIKE button,
. . . . . . . . . . Drop some feedback below in the comment!
❤️ Your support is very much 🙏 appreciated! ❤️
💎 Want us to help you become a better Forex / Crypto trader ?
Now, It's your turn !
Be sure to leave a comment; let us know how you see this opportunity and forecast.
Trade well, ❤️
ForecastCity English Support Team ❤️

TRXUSD channel, fib, gann analyseI am not a trading and investment adviser. I am only drawing my dream

Justin TRON timedont forget BTT too
breaking resistance september and still uptrend from mid 2021 until now
after retest, TRX will going ATH, In My Opinion

TRX BO 0.120 ? TRX BO above 0.120
MACD momentum still strong
next..
by EOD closing must be above 0.120.
next hard resistance at 0.16
if by EOD close below 0.12, market may continue sideways.
DYODD.

Break through the pressure and take offBreak through the pressure and take off
Breakthrough pressure immediately catch up


TRON ( TRX )Hello friends, considering that the general trend is bullish and the strength of the trend is strong, it can grow well in the short and medium term, and it is the best opportunity for investment to be profitable.

TRON | UPTREND | From the Past We learn the Future... LONG Welcome back Traders, Investors, and Community!
Check the Links on BIO and If you LIKE this analysis, Please support our Idea by hitting the LIKE 👍 button
Traders, if you like this idea or have your own opinion about it, please write your own in the comment box . We will be glad for this.
Feel free to request any pair/instrument analysis or ask any questions in the comment section below.
Have a Good Day Trading !

a dreamy expanded trianglefinally I find a dreamy TA on Tron today and I'm extremely bullish on TRX now. could it explode this week?
cypher and shark targetscypher or shark harmonic pattern:
AB=0.38 XA
BC=1.13 AB
tp1=1.6 BC=$0.11 *reached*
tp2=0.78 XA=$0.147 *reached*
tp3=2 BC=0.88 XA=$0.2 cypher reversal
tp4=2.24 BC=$0.3 shark reversal
tp5=1.13 XA=$0.46 shark reversal

I fall in love with technical of Tron recentlyFibo levels:
1.6 BC=$0.126
2 BC=$0.357
2.24 BC=$0.689
2.6 BC=$1.93
3.6 BC=$29.7

TRON (TRX) - November 13Hello?
Welcome, traders.
By "following", you can always get new information quickly.
Please also click "Like".
Have a nice day.
-------------------------------------
(TRXUSD 1W Chart) - Medium to Long-Term Perspective
Above the 0.04413840 point: the uptrend expected to continue
(1D chart)
First resistance section: 0.11243825-0.12543392
Second resistance section: near 0.16442092
Support section: near point 0.08644692
If the price can hold in the range 0.10168507-0.12748467 (up to 0.09289318-0.12748467), I expect to accelerate the uptrend.
If the price declines from the 0.08238160 point, it may fall below the 0.064045559 point, so a short-term stop loss is necessary.
------------------------------------------
(TRXBTC 1W Chart)
Over the 259 Satoshi-318 Satoshi section: It is expected to create a new wave.
------------------------------------------
We recommend that you trade with your average unit price.
This is because if the price is below your average unit price, whether it is in an upward trend or in a downward trend, there is a high possibility that you will not be able to get a big profit due to the psychological burden.
The center of all trading starts with the average unit price at which you start trading.
If you ignore this, you may be trading in the wrong direction.
Therefore, it is important to find a way to lower the average unit price and adjust the proportion of the investment, ultimately allowing the funds corresponding to the profits to regenerate themselves.
------------------------------------------------------------ -------------------------------------------
** All indicators are lagging indicators.
Therefore, it is important to be aware that the indicator moves accordingly with the movement of price and volume.
However, for the sake of convenience, we are talking in reverse for the interpretation of the indicator.
** The MRHAB-O and MRHAB-B indicators used in the chart are indicators of our channel that have not yet been released.
(Because it is not public, you can use this chart without any restrictions by sharing this chart and copying and pasting the indicators.)
** The wRSI_SR indicator is an indicator created by adding settings and options to the existing Stochastic RSI indicator.
Therefore, the interpretation is the same as the traditional Stochastic RSI indicator. (K, D line -> R, S line)
** The OBV indicator was re-created by applying a formula to the DepthHouse Trading indicator, an indicator disclosed by oh92. (Thanks for this.)
** Support or resistance is based on the closing price of the 1D chart.
** All descriptions are for reference only and do not guarantee a profit or loss in investment.
(Short-term Stop Loss can be said to be a point where profit and loss can be preserved or additional entry can be made through split trading. It is a short-term investment perspective.)


TRX USD Green VS RedI'm publishing this chart because my account only allows me to save a few charts...
