TRXUSDT BUY SETUPTRX potential making HNS PATTERN
you can buy now or buy limit
GoodLuck guys !
*Follow for more, free!
Like & comment
DYOR
TRXUSDT_A98D8A trade ideas

TRX/USDT bullish momentum?? 👀 🚀 Tron Today Analysis💎Paradisers, gear up for a fantastic opportunity with TRXUSDT! We're currently observing it testing resistance levels and setting the stage for a bullish ascent👀
💎Right now, we're looking at two potential scenarios. First, if the price of TRX successfully breaches the resistance at $0.08459, expect a bullish surge. On the other hand, if selling pressure remains strong and the price fails to break through the resistance, we anticipate a retest of the support level at $0.08111, where a bullish continuation could occur.
💎Additionally, if the support level at $0.08111 is broken, consider planning a short entry in #Tron. In this case, your take-profit should be set at the next support level.
Keep your charts updated and Stay one step ahead of the market 🌴

TRON H1 2023 OverviewTRON is an open-source, public blockchain network designed for the creation and
deployment of decentralized applications (dApps) founded in 2017. TRON officially
became a decentralized autonomous organization (DAO) in Dec 2021, making it one of the
largest community-governed DAOs.
It employs a Delegated-Proof-of-Stake (DPoS) consensus mechanism, where 27 Super
Representatives are elected every six hours to maintain the network. TRON's Virtual
Machine (TVM), which uses "Energy & Bandwidth" instead of gas, allows affordable
execution of smart contracts and is compatible with Ethereum's Virtual Machine (EVM).
With a multi-layered architecture, TRON is recognized for its high transaction speed, low
cost, and hosts the largest circulating supply of stablecoin Tether (USDT).
Fundamentals and Performance
At the end of H1 2023, TRON’s block height exceeded 52.5 million. There were 7,385
nodes across the network, representing a 33.5% increase over H1.
In early April, the deployment of Stake 2.0 (TIP-467) on TRON’s mainnet was approved.
Stake 2.0 aims to bring greater flexibility to the TRON staking model, enhancing resource
utilization and system stability. It separates high-frequency resource delegation from low frequency staking operations, allowing resource re-delegation without unstaking and
improving resource management. By adding stake, delegate, and vote commands to the
TRON Virtual Machine (TVM), it expands use-cases and supports more applications.
Moreover, Stake 2.0 introduces a delay in unstaked TRX arrival to bolster the staking
model's stability and create a more predictable network for participants while removing
the 3-day non-voting period.
At the end of H1, TRX staked through Stake 2.0 accounted for 10.8% of the total stake,
benefiting from added support for Stake 2.0 by the likes of Trust Wallet, Gaurda Wallet,
NOW Wallet, and Via Wallet, among others.
For the full report click here .

TRX CAN FALL VERY SOON (1D)The structure of TRX in the daily and weekly time frame is the same as the previous analysis. The correction has started from the place where I have marked the red arrow. It means a big diametric!
But the trx went above the red box of the previous analysis and made a stop hunt.
I think we are at the end of wave F and we will have a fall for wave G.
In the red box, we are looking for a downward trigger to enter the sell/short position.
The green area is relatively strong support.
I specified the invalidation level, closing a daily candle above this level will violate the analysis
For risk management, please don't forget stop loss and capital management
When we reach the first target, save some profit and then change the stop to entry
Comment if you have any questions
Thank You

TRX trading planHorizontal supp/resis lines in yellow
2 ascending support lines
ascending RSI support line
Breakdown depends on BTC movement in terms of timeline

trend is bullish looking for the long entryH4 Support 0.07188 to 0.07279
H4 Resistance 0.09115 to 0.09439
H1 Support 0.08793 to 0.08831
H1 Resistance 0.08938 to 0.08988
the overall trend is up price has recently broken its H1 resistance level,
on retesting the previous resistance level, we can find the buy reason and take a long entry
target should be the resistance level of H4

TRXUSDTThis is a 1D frame analysis for TRXUSDT The price is fluctuating within the supply and resistance zone and if it fails to establish itself above the resistance line, we can expect a decrease in price. However, if it is able to establish itself above the supply and resistance zone, it can move towards its second resistance line. We expect the price to return to its support zone and, following a bullish pattern, move towards the resistance zones after it hits the support line and establishes itself above it. If it breaks and establishes itself below the line, it can start moving towards its next support line after a pullback.

TRX Crypto TRON Sell TP = 0.08602On the hour chart the trend started on Sept. 29 (linear regression channel).
There is a high probability of profit taking. Possible take profit level is 0.08602
But we should not forget about SL = 0.0899
Using a trailing stop is also a good idea!
Please leave your feedback, your opinion. I am very interested in it. Thank you!
Good luck!
Regards, WeBelieveInTrading

TRXUSD ❕ reached the resistanceRSI is in overbought zone on 4H and 1H Timeframes.
Price has formed a divergence.
TRX formed an inverted hammer (30m TF)
I expect a correction.

Rising wedge AMEX:TRX 🧐 Nice rising wedge, however I still need a break below that dotted line for sellers to take back full control..Only a matter of time..⏳✍

💡Trade Idea #TRX/USDT:#Tron looks insanely bullish on the daily timeframe. Look at the latest fakeout. If we break this pattern upwards try to act fast. A possibility to make sweet gains, but also there is a chance to get “sweetly” liquidated.

TRX 8% Drop Likely!When taking a look at the legendary TRX, we can see that it is showing signs of weakness after failing to trade above the recent high 3 times in a rom. If price continues down, I would expect a 8% drop to the golden pocket which lines up with the horizontal support .
Every day the charts provide new information. You have to adjust or get REKT.
Love it or hate it, hit that thumbs up and share your thoughts below!
Don't trade with what you're not willing to lose. Calculate Your Risk/Reward!
This is not financial advice. This is for educational purposes only.

TRX Elliot wave predictionIn my point of view coming days we can see TRX in 0.83$ area. Then it may retrace back to 0.69$ area or below. In the end of this year TRX may start it's 3rd wave and can pump to previous ATH

TRX Short, JustLend insolvency, very asymmetrical risk-rewardReally there's no reason for me to post this here, but since ideas (at least the chart) cannot be edited retro-actively, maybe I'll get hired off of this and someone will give me 100 mill to play with at a trading desk once my theory proves correct.
I believe Justin Sun's JustLend platform is insolvent and it's another Terra Luna / FTX type situation brewing. On top of that, going just by TRX's chart and TA alone, it's primed for a major correction.
All other major DeFi lending platforms have roughly $1.5 - $3 dollars on the supply side for every $1 on the borrow side. Since the borrow side APYs are often 2-3x higher than supply side APYs, these numbers at glance make sense and seem sustainable, dare I even say, Allah forgive me, profitable for the platform.
AAVE TVL $4.597b
AAVE BORROWED $2.478b
COMP TVL $1.923b
COMP BORROWED $909.26m
SPARK TVL $441m
SPARK BORROWED $199.88m
VENUS TVL $957.03M
VENUS BORROWED $334.32M
(Core pool)
MORPHO TVL $917.95M
MORPHO BORROWED $463.97M
Queue Justin Sun's JustLend.
For every $1 on the borrow side, there's...$55 on the supply side. Yup.
It doesn't take a PhD mathematician to understand that in order for a supply-borrow ratio of 55:1 to be sustainable whilst offering DeFi market competitive APY rates, the borrowers would have to pay such obscenely high interest rates, it would put your local friendly loansharks Vlad & Olek to shame.
Yet, JustLend seems to offer APY's comparable to platforms with a healthy supply-borrow ratios. How is this sustainable then? Fraud, stupidity and debauchery - going by occam's razor.
So Justin Sun being a crafty little fella, wanted to get his hands on the crypto equivalent of JPow's LaserJet 9000 HP, ideally without the public's knowledge
He then proceeded to recently print nearly a billion USD "worth" of TUSD, and deposit that into his platform
He staked Wrapped Staked USDT (wstUSDT) because there's no borrow APY but massive supply APY.
So even at 0% pool utilization from the borrower's side, there's 4.21% APY for the supply side. Where the hell is this money coming from? Well, fret not, as Justin as a one word answer for us. T-Bills. Yep.
However there isn't a single iota of proof anywhere, on-chain or off-chain, that these T-Bills exists and are actually sitting somewhere, bought by real hard cash, earning that sweet sweet 5%.
Furthermore, T-Bills are 5%, but some pools offer at high utilization % of the pool upwards of 30% APYs.
The entirety of JustLend feels like 2 + 2 = apple pie. Nothing here adds up or checks out, but maybe I'm just too autistic to understand Justin's genius.
wstUSDT, the made up "stablecoin" by Justin actually has a higher supply side APY than borrow APY. This is like your local retail bank giving you a 3% mortgage while the feds fund rate is at 5.5%. It doesn't make any sense.
There could be multiple explanations for what he's doing with the printed TUSD.
1) Best case scenario, there's unironically $850~ mill sitting somewhere, actually backing these TUSD tokens 1:1. Which means he deposited the money into his own pool, in order to farm his own token, to launder money.
Either "Look guys, I didn't print this money out of thin air, I farmed it in my lending platform"
Or "This is not dirty money, look I launde...I mean earned it via farming it in my lending platform"
2) The unfortunately much more likely scenario, is that Justin's billion dollar airdrop isn't backed 1:1 by real cash, and quite possibly isn't backed at all due to him having direct access to the Print button. He's deposited the money into his platform to prop the failing platform up, in order to be able to cover the large discrepancy between what borrowers are paying for the platform versus the APY that has been promised to the liquidity suppliers.
Possibly using the farmed tokens to swap them out for other (supposedly farmed) rewards in the backend to be able to pay out those yields.
I will post more tidbits in the comments later. I'm not able to post links unfortunately, but everything I talk about can easily be verified by google.

Power is on bears TRX SHORTTRX looks good to short in low time but big picture shows on a bullish range

TRX (Crypto TRON) Buy TF H4 TP = 0.0849On the 4-hour chart the trend started on August 21 (linear regression channel).
There is a high probability of profit taking. Possible take profit level is 0.0849
But we should not forget about SL = 0.0744
Using a trailing stop is also a good idea!
Please leave your feedback, your opinion. I am very interested in it. Thank you!
Good luck!
Regards, WeBelieveInTrading

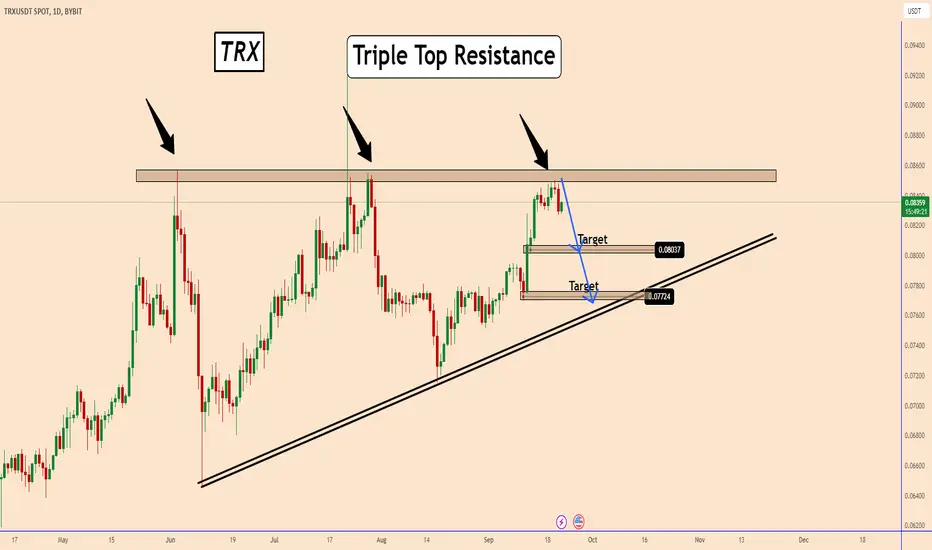
📣TRX -Triple Top within a daily triangle📣#TRX -Triple Top within a daily triangle
ON the daily chart the price is testing a strong key resistance
zone located near 0.08600.
The price reacted two times in that area and the chances
are higher for a bearish wave again.
A sell near 0.0840-0.0845 can give us better trading
opportunities with targets 0.0800 and 0.0770
Thank you and Good Luck!
TRXUSDT ShortShort if the current price respect the supply zone. I need to see a broken structure on the yellow line, then look for a retest area before entering this trade

TRON IN CONTROL OF BEARSCurrently Tron has formed a rising wedge pattern inside ascending channel and what i'm anticipating is the formation of H&S pattern and after breakout of H&S pattern along with rising wedge and also the ascending channel a good short trade can be captured.
Target - 0.08050

HTF TRX AnalysisLooks like TRX has completed a 5 wave structure and is now half way through an ABC corrective wave.

💡Trade Idea #TRX/USDT:Keep an eye on #TRX. There is a potential for a massive movement upwards. Would be perfect to see a breakout and clean retest.

Tron TRX: Looks Like It Will Dump Again?This looks like a cool rejection on a lower time frame, let's see how it pans out in next few days.
What are your thoughts about this analysis? Let me know in the comment box.
If this analysis makes sense to you, kindly follow me now for more, like, and support my idea.
Cheers!

waiting for opportunity im waiting it should touch the resestins level then go down ..
let see ..
wish u happy weekend
