🧐TRX Price Analysis! In-Depth Structure Analysis🧐TRX Price Analysis! In-Depth Structure Analysis
In this chart, we will see a detailed analysis of the structure related to the Tron network (TRX)
Price has reacted very well to the structure in the past and it's worth keeping an eye on this instrument these days.
You may watch the video analysis for more details.
Thank you and Good Luck!
TRXUSDT_A98D8A trade ideas


TRX Upside Trend Still Ahead in Mid-Term.>>>>>>>>Hello EveryOne
I Have Tried My Best to Bring the best Possible outcome in this Chart.
TRX can correct to next level but in longer time frame. could Start again Upside trend .
We can buy In correction for SPOT trade.
Buy 0.067_0.065
0.059_0.057
0.049_0.050
Target's
0.075_0.0805
0.085_0.090
0.097_0.103
Stoploss : HOLD
CRYPTOCAP:TRX
It's just an analyze,
Not a financial advise.
PLZ DYOR
With hopping success>>>>>>>>>

✅TS ❕ TRXUSD: support level✅✅ TRX is testing the support level after the previous bounce.
The asset will continue to grow if it holds support. ✅
🚀 BUY scenario: long to 0.0702. 🚀
----------------------------------------------------------------------------
Remember, there is no place for luck in trading - only strategy!
Thanks for the likes and comments

symbol(TRXUSDT)long TF1DHello
I am Araz
This is the TRX daily time frame analysis for loved ones who like to use it

TRX BULLISH FLAG 🤔🚩🤔🚩🤔Hi dear traders
TRX hold above EMA50 and has formed bullish flag.
IF pattern confirmed we can take some profit 📈 in short term.
Let's see what happens
This is not financial advice ( DYOR )
Good luck

TRX Good For LongTRX Price Break Bull Flag With Good Volume And Now Complete Retest Trend Line And Also Take Sport From 0.618 Fib Level.
I Think This is The Right Time To Take Long Trade On TRX
If BTC Take Good Move Then You Can See Good Move In TRX Price.
For The Rest Of The Details Please Click On Related Idia

TRX Price PredictionBull Flag Showing In 1 Hour Time Fram and One More Thing You Can See In Pic The Price Hold 0.618 Fib Levle Witch Is Very Important Level And May Be Price Soon Break The Uper Trend Line And Good For Long.
We Have Resistance On 0.07241 in Day Time Frame If Market Break This Level Then Market Go More Up.
If You Like My Analysis Please Follow Me Plus Like And Comment.

TRON Weekly View - February 2023Hello Guys, Weekly Analysis is on the TRXUSDT Symbol in a 4H Time frame, I Hope it Will be Useful for You, Don't Forget to Like, Follow, Comment

TRXUSDT - Good opportunity
TRXUSDT :
It seems that the price will move up from this area.
Of course
After crossing 0.65157
You can place a stop-buy and place a stop loss below the red downtrend.
Or wait for the confirmation.

TRX IdeaTRXUSDT | TRXUSD
✅ ✅ Risk warning, disclaimer: the above is a personal market judgment and analysis based on published information and historical chart data on The trading view,
And only some of these analyzes are my actual real trades.
I hope Traders consider I am Not responsible for your trades and investment decision.

TRON DONE ACCUMULATINGTRON $TRX has been in a long long long accumulation phase, no significant big price movements for a year just about.
Indicators look bullish, money flow teetering around the mid-line, RSI looking for continuation.
I think it will be a slow mover for another week or so, but shouldnt retrace or correct any lower than 0.06, probably the bottom.
Also adjusting for lower fees is ultimately bullish for TRX in the future.
ENTRY- 0.07006 @ 5x leverage
LIMIT ORDERS - $0.067, $0.0635
NO STOP LOSS IM CONFIDENT THIS WILL NOT COME CLOSE TO LIQUIDATION OR EVEN 0.06 again. however this is crypto and anything is possible.
GL TO ALL

TRX USDT | TRX broke a massive resistance !!#TRX/USDT
🟢Entry price: from now to 0.064
🎯Targets:
|> 0.07091
|> 0.08151
|> 0.09279
🔴Stop-loss: 0.06060 (1D candle Close under it)
for risk takers, I recommend setting stop-loss at 0.0588 (1D candle Close under it)
➡️Recommended risk: 0.5%
➡️Recommended Position Size: 9%
please note that due to the current market situation, this trade signal is considered risky, so we must stick together to stop loss and risk management strategy and not gamble with our money.
stay safe and trade safe
thank you!

TRXUSDT Symmetric Triangle Breakout!TRXUSDT Technical analysis update
Buy zone: Below $0.071
Stop loss : $0.062
Take Profit 1 : $0.078
Take Profit 2 : $0.090
Take Profit 3 : $0.105
Take Profit 4 : $0.128
Swing trade setup
Thanks
Hexa

triangle patern . TRXUSDTfirst target can guarantee 30% . for an other target you can bring's up your SL to opening price and TP to second place . if this pattern not work i thinks it's problem from volume .

TRXUSD ❕ support zoneTRX is trading near the support area.
TD Sequential has formed an upside reversal signal (1H TF)
I expect a rebound when it fixes above the lower support boundary.

TRX triangle breakoutPlease 1st of all click the boost 🚀 button if you want me to post more ideas and follow me to support my work! It's absolutely for free.
Tron broke up this triangle📐 and now backtested it's upper edge. I think there is chance for run to 0.06905 and even lower. Buying here makes sense to me.
ENTRY : @ 0.06270
STOPLOSS (SL) : local high @ 0.06093
TARGET (TP) : height of the triangle projected from midpoint of the local range @ 0.06905
REWARD RISK RATIO (RRR) : 3.3
INVALIDATION : when SL level hit
Check my other stuff in related ideas.
Please boost🚀, comment🗣️, follow me✒️, enjoy📺!
⚠️Disclaimer: I'm not financial advisor. This is not a financial advice. Do your own due dilingence.

TRX inverted H&SIn the beginning of this year Tron broke up the major downtrendline☝️. Then after this👇 sucessful call...
... TRX formed Inverted Head and Shoulders 🤷 on the daily timeframe and triggered the pattern by breaking the neckline up (zoom in to see the details). Price then fell back down below the neckline and recently broke up once again. I think there is chance for run to 0.08555 and even higher. The yellow uptrendlines could act as a guide.
INVALIDATION (SL) : Right Shoulder @ 0.05879
TARGET (TP) : Inverted H&S target projection @ 0.08555
Check my other stuff in related ideas.
Please boost🚀, comment🗣️, follow me✒️, enjoy📺!
⚠️Disclaimer: I'm not financial advisor. This is not a financial advice. Do your own due dilingence.


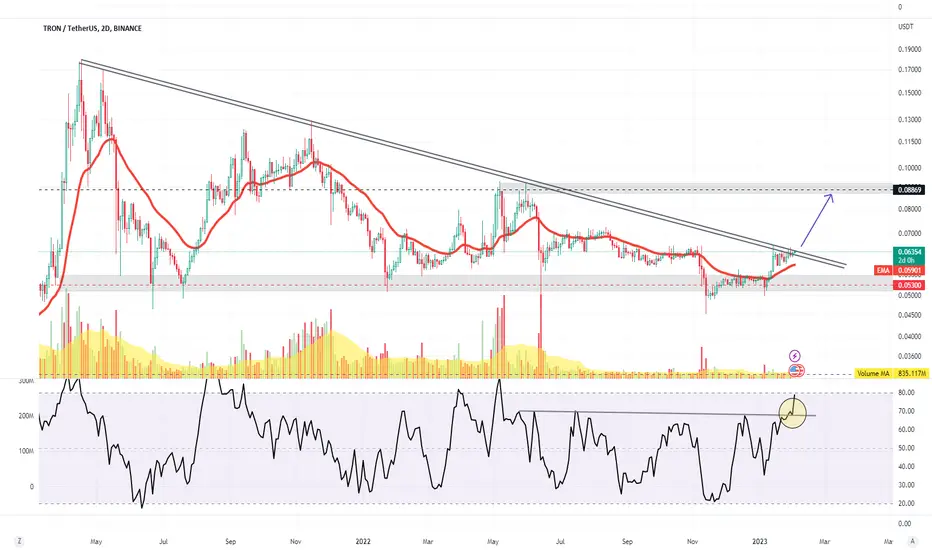
TRX ready to for a break-out
TRX was stuck under the longterm trendlines(s) while many other big cap in top 20 had already break-out.
BTC turns bullish is a good opportunity for TRX to break the trendline and fly.
MFI indicators had already in good buy region supporting this break-out.
TPX may test global highsOn the chart, 1 week TF:
0.14927 - the global resistance level, a global correction or a local downtrend started from it!
0.04637 - acts as a support and trend break level. local trends from it repeatedly changed the downtrend to a local uptrend. has confirmation.
0.08846 - mirror level! after its formation and confirmation in the form of resistance, the price of the asset updated local lows and confirmed the presence of the level of 0.4637.
0.06550 - local resistance level formed for 1 week TF. Has confirmation in the form of touches!
Pay attention - after a false breakout of the level of 6550, the price of the asset did not turn around, but now it breaks through it again. Just as important is the descending line of clubs that was broken 4 attempts!
It is important to understand that the price of an asset may continue to find a flat and continue to move sideways, however, this does not exclude the possibility of trying to trade with a stop and positionally.

Tron's price volatility range is expected at a level of $0.060For the current week, we can expect the trend to be in the range for the current week, as long as we do not have a strong return below the $0.060 level. But if the selling pressure increases, Tron's price decline can continue to the bottom of the channel, i.e. the support range of $0.056 to $0.058. This week, the TRX price volatility range is expected at a level of $0.060.

tronI think the downward trend line will be broken and the rise of the market is not far from expected, it is not a buy or sell signal and it is just a personal opinion
