UMAUSDTWe can attempt to short UMAUSDT from specified level if it break HL , also bearish divergence occur indicate that it moves downward.
SL , TP mention in chart.

UMAUSDTUMA ~ 5D ✅
#UMA Make purchases gradually in this pattern. In our opinion, it is only a matter of time that this descending pattern is successfully broken.

UMA - Three D(r)ives Down PATTERNUMA is approaching an ideal buy-back zone whilst forming an important chart pattern - the Three Dives Down Pattern.
This pattern goes by many names including Three Drivers, Three Drives Down and Three Dives Down (which is the one I prefer to use). This pattern is bearish for the SHORT term, but bu

UMAUSDT.1DAnalyzing the UMA/USDT chart on a daily timeframe provides insight into its recent performance and potential future trends. The chart reflects a volatile but generally bearish trend, highlighted by a significant spike followed by a consistent decline.
Key Observations:
Resistance and Support Level

#UMA/USDT is trying to break the Diagonal Trendline in 4-Hour TF#UMA/USDT is trying to break the Diagonal Trendline in 4-Hour TF!
NSE:UMA needs to break the trendline to turn bullish. Wait for a successful retest to long #UMAUSDT. The local resistance level is PWH $2.19, and the support level is PML $1.699.

UMAUSDTHM Triangle BO v1.0 spotted. Looking good with previous wave up with increasing volume and momentum.
- BOS (Breaks of Structure) at @ 1.993-1.932 level
- Trending slow and steady if able to hold above the BOS level
It is at extremely good reward to risk level.

UMAUSDT.PUMAUSDT.P is in bullish trend.
Bullish divergence also form.
printing HH and HL.
We wait and watch for the breakout of last HH.

UMA ANALYSIS (1D)Now we have more data on the chart and the scenario seems clearer.
From the place where we entered "start" on the chart, the UMA correction has started.
This correction seems to be a large diametric that we are now in wave E of this diametric.
If the price reaches the green range, we will look fo

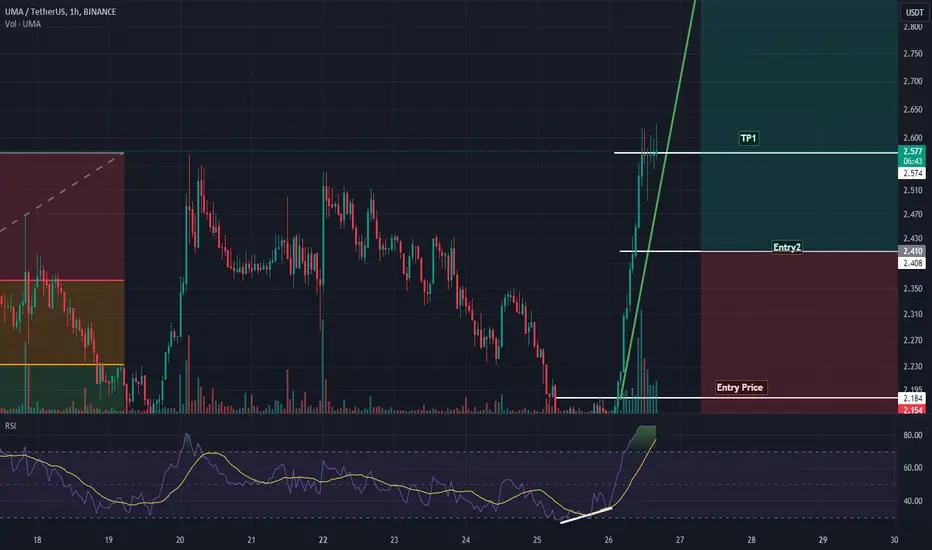
UMA LONG IDEAHi Team, this is UMA Long Idea price will retrace first sweeping of sell side liquidity then will be running into the upside hitting up the buying liquidity, remember to use wise money management

UMAUSDT Making Higher HIGH, It can go up to break the records???UMAUSDT make sign to buy at the bottom of the trend(Double Top)
Broken the Neckline and Starts making Higher High and Higher Low.
Trend it not over yet, IT has potential to break 3 ASAP.
I have shared the trading setup
See all ideas