USD/CAD(20250404)Today's AnalysisMarket news:
Countermeasures from many countries against the United States - ① It is reported that Europe will slow down the pace of tariff retaliation; EU member states will vote on countermeasures against US steel and aluminum tariffs on April 9; ② Macron said that the response to US tariffs will be larger than before, and called on French companies to suspend investment in the United States. France may plan to impose retaliatory tariffs on large US technology companies. ③ Canadian Prime Minister Carney: Canada will impose a 25% tariff on all cars imported from the United States that do not comply with the US-Mexico-Canada Agreement.
Technical analysis:
Today's buying and selling boundaries:
1.4147
Support and resistance levels:
1.4436
1.4328
1.4258
1.4036
1.3966
1.3858
Trading strategy:
If the price breaks through 1.4147, consider buying, the first target price is 1.4258
If the price breaks through 1.4036, consider selling, the first target price is 1.3966
USDCAD_LMAX trade ideas

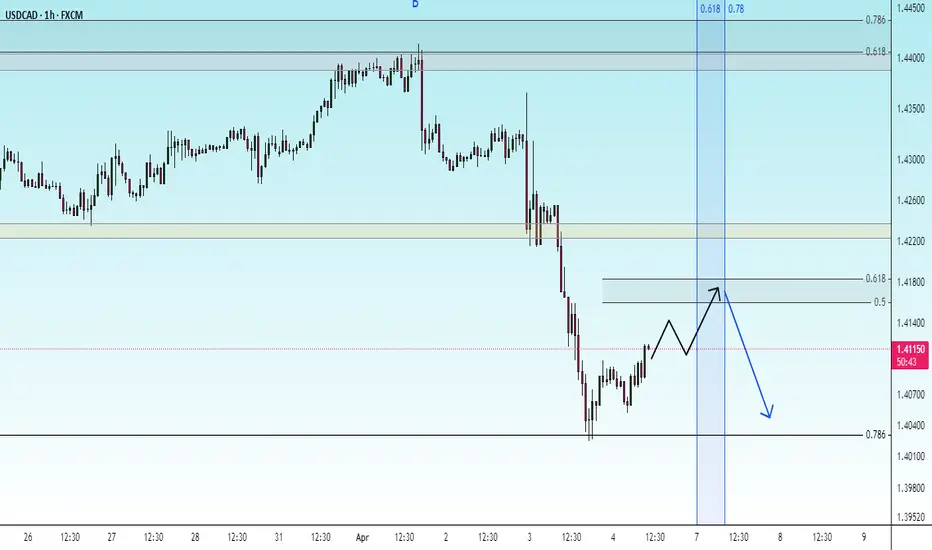
USDCAD Bullish MoveThere is a Bigger Structure on the D1 that we are expecting..lets enjoy the trade

correctionIt is expected that the upward trend will form until the resistance levels and the specified time frame. Then there is a possibility of a trend change.
Bearish drop off pullback resistance?The Loonie (USD/CAD) is rising towards the pivot and could revrse to the 1st support which acts as an overlap support.
Pivot: 1.4155
1st Support: 1.3946
1st Resistance: 1.4309
Risk Warning:
Trading Forex and CFDs carries a high level of risk to your capital and you should only trade with money you can afford to lose. Trading Forex and CFDs may not be suitable for all investors, so please ensure that you fully understand the risks involved and seek independent advice if necessary.
Disclaimer:
The above opinions given constitute general market commentary, and do not constitute the opinion or advice of IC Markets or any form of personal or investment advice.
Any opinions, news, research, analyses, prices, other information, or links to third-party sites contained on this website are provided on an "as-is" basis, are intended only to be informative, is not an advice nor a recommendation, nor research, or a record of our trading prices, or an offer of, or solicitation for a transaction in any financial instrument and thus should not be treated as such. The information provided does not involve any specific investment objectives, financial situation and needs of any specific person who may receive it. Please be aware, that past performance is not a reliable indicator of future performance and/or results. Past Performance or Forward-looking scenarios based upon the reasonable beliefs of the third-party provider are not a guarantee of future performance. Actual results may differ materially from those anticipated in forward-looking or past performance statements. IC Markets makes no representation or warranty and assumes no liability as to the accuracy or completeness of the information provided, nor any loss arising from any investment based on a recommendation, forecast or any information supplied by any third-party.

USD/CAD H4 | Overhead pressures remainUSD/CAD is rising towards a pullback resistance and could potentially reverse off this level to drop lower.
Sell entry is at 1.4159 which is a pullback resistance that aligns with the 38.2% Fibonacci retracement.
Stop loss is at 1.4243 which is a level that sits above the 50.0% Fibonacci retracement and an overlap resistance.
Take profit is at 1.4024 which is a swing-low support.
High Risk Investment Warning
Trading Forex/CFDs on margin carries a high level of risk and may not be suitable for all investors. Leverage can work against you.
Stratos Markets Limited (www.fxcm.com):
CFDs are complex instruments and come with a high risk of losing money rapidly due to leverage. 63% of retail investor accounts lose money when trading CFDs with this provider. You should consider whether you understand how CFDs work and whether you can afford to take the high risk of losing your money.
Stratos Europe Ltd (www.fxcm.com):
CFDs are complex instruments and come with a high risk of losing money rapidly due to leverage. 63% of retail investor accounts lose money when trading CFDs with this provider. You should consider whether you understand how CFDs work and whether you can afford to take the high risk of losing your money.
Stratos Trading Pty. Limited (www.fxcm.com):
Trading FX/CFDs carries significant risks. FXCM AU (AFSL 309763), please read the Financial Services Guide, Product Disclosure Statement, Target Market Determination and Terms of Business at www.fxcm.com
Stratos Global LLC (www.fxcm.com):
Losses can exceed deposits.
Please be advised that the information presented on TradingView is provided to FXCM (‘Company’, ‘we’) by a third-party provider (‘TFA Global Pte Ltd’). Please be reminded that you are solely responsible for the trading decisions on your account. There is a very high degree of risk involved in trading. Any information and/or content is intended entirely for research, educational and informational purposes only and does not constitute investment or consultation advice or investment strategy. The information is not tailored to the investment needs of any specific person and therefore does not involve a consideration of any of the investment objectives, financial situation or needs of any viewer that may receive it. Kindly also note that past performance is not a reliable indicator of future results. Actual results may differ materially from those anticipated in forward-looking or past performance statements. We assume no liability as to the accuracy or completeness of any of the information and/or content provided herein and the Company cannot be held responsible for any omission, mistake nor for any loss or damage including without limitation to any loss of profit which may arise from reliance on any information supplied by TFA Global Pte Ltd.
The speaker(s) is neither an employee, agent nor representative of FXCM and is therefore acting independently. The opinions given are their own, constitute general market commentary, and do not constitute the opinion or advice of FXCM or any form of personal or investment advice. FXCM neither endorses nor guarantees offerings of third-party speakers, nor is FXCM responsible for the content, veracity or opinions of third-party speakers, presenters or participants.

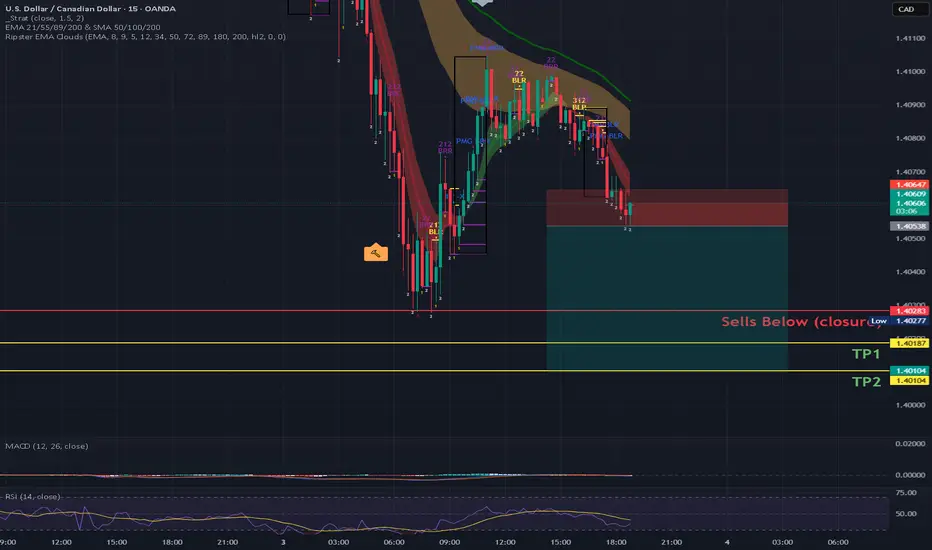
SELLSLooking to take a sell here. I'm getting in a little early. my "Sells after closure" is due to taking out yesterdays lows. hoping for a push to take out to daily pivots
USDCAD WHAT TO LOOK FOROur analysis is based on multi-timeframe top-down analysis & fundamental analysis.
Based on our view the price will fall to the monthly level.
DISCLAIMER: This analysis can change anytime without notice and is only for assisting traders in making independent investment decisions. Please note that this is a prediction, and I have no reason to act on it, and neither should you.
Please support our analysis with a like or comment!
Let’s master the market together. Please share your thoughts and encourage us to do more by liking this idea.

Tariff U-turn risk now part of the trade Yesterday, President Donald Trump announced his "Liberation Day" tariff strategy, introducing a universal 10% tariff on all imports, with higher rates for specific countries.
Despite Commerce Secretary Howard Lutnick’s claim that President Trump “won’t back off,” several pressures could still force a reversal before their April 9 implementation.
Markets have already reacted negatively, and trading partners are signalling how they might retaliate.
French President Emmanuel Macron has urged European companies to suspend investment in the U.S. In Canada, Prime Minister Mark Carney said he is planning to pivot toward more reliable partners like Australia, the U.K., and France.
A U-turn by the Trump administration would likely be framed as a strategic win rather than inconsistent policy making—but for traders, volatility may remain a welcome constant from this administration.

Bullish bounce off overlap support?USD/CAD is falling towards the support level which is an overlap support that aligns with the 61.8% Fibonacci retracement and the 145% Fibonacci extension and could bounce from this level to our take profit.
Entry: 1.3953
Why we like it:
There is an overlap support level that aligns with the 61.8% Fibonacci retracement and the 145% Fibonacci extension.
Stop loss: 1.3743
Why we like it:
There is a pullback support level that lines up with the 78.6% Fibonacci retracement.
Take profit: 1.4169
Why we like it:
There is a pullback resistance level.
Enjoying your TradingView experience? Review us!
Please be advised that the information presented on TradingView is provided to Vantage (‘Vantage Global Limited’, ‘we’) by a third-party provider (‘Everest Fortune Group’). Please be reminded that you are solely responsible for the trading decisions on your account. There is a very high degree of risk involved in trading. Any information and/or content is intended entirely for research, educational and informational purposes only and does not constitute investment or consultation advice or investment strategy. The information is not tailored to the investment needs of any specific person and therefore does not involve a consideration of any of the investment objectives, financial situation or needs of any viewer that may receive it. Kindly also note that past performance is not a reliable indicator of future results. Actual results may differ materially from those anticipated in forward-looking or past performance statements. We assume no liability as to the accuracy or completeness of any of the information and/or content provided herein and the Company cannot be held responsible for any omission, mistake nor for any loss or damage including without limitation to any loss of profit which may arise from reliance on any information supplied by Everest Fortune Group.

03-04-2025 _ Short Term Bearish Idea _ USDCAD M301- Price is moving in a down trend.
2- Looks like correction is happening at the moment.
3- After correction ~ 38.2% - 61.8% Fibo. Retracement, one
can expect a push to the downside.
4- Look for Sell Setups.

USDCAD: Trump's Tariffs Shake USD/CAD - A Bearish Wave in MotionUSDCAD: Trump's Tariffs Shake USD/CAD - A Bearish Wave in Motion
Yesterday, Trump announced his most extensive tariffs yet, imposing at least 10% duties on all trading partners except Canada and Mexico. For some countries, these tariffs exceed 20%, 30%, or even more.
This move boosted the Canadian dollar (CAD), as it appears to be one of Trump's preferred currencies. Overnight, the USDCAD pair dropped nearly 140 pips, testing levels seen on March 26th, March 6th, and February 25th.
By this morning, USDCAD broke through a strong support zone, falling further to 1.4120—a decline of nearly 250 pips in just 12 hours.
The market expects that these tariffs could lead to significant challenges for the US economy in the coming years. After this sharp drop, USDCAD might take a breather before continuing its bearish trend.
Key support levels: 1.4050, 1.3930, and 1.3800.
You may find more details in the chart!
Thank you and Good Luck!
❤️PS: Please support with a like or comment if you find this analysis useful for your trading day❤️
Disclosure: I am part of Trade Nation's Influencer program and receive a monthly fee for using their TradingView charts in my analysis.


USD/CAD Bullish Trade Setup: Key Support, Entry, and Target AnalThis chart is a technical analysis of the USD/CAD currency pair on a 3-hour timeframe. Here’s a breakdown of the key elements:
Key Observations:
1. Exponential Moving Averages (EMAs):
200 EMA (Blue Line) at 1.43318 – A long-term trend indicator.
30 EMA (Red Line) at 1.43135 – A short-term trend indicator.
The price is currently trading above both EMAs, suggesting a bullish bias.
2. Support and Resistance Levels:
A support zone (purple box) around 1.43010 to 1.43141 has been identified, which the price is expected to respect.
The target level (EA TARGET POINT) is set at 1.44511, indicating a bullish price movement expectation.
3. Entry, Stop Loss & Take Profit:
Entry Point: Near the 1.43318 level (current price area).
Stop Loss: Placed below the supp

USDCAD 3rd April LTF long HTF ShortAfter the chaos that was the markets with President Trumps announcements yesterday there is a few imbalances that need filling.
Whether they will fill quickly is anyones guess but I'm working on the theory shown in the image above.
If we get the break of structure marked as BOS 5M then I would suspect a retracement to a level close to where my long is marked on the chart. I'll mark this out more clearly once we have the initial break of structure.
My target ideally would be the Supply zone marked as Supply 15M, (1.43072) but as I've been hitting a lot of losses recently I'd be tempted to take profit at the marked 2.5R or at least to take a partial.
Then longer term I expect that the action will go as high as this supply zone ready for a short as per the HTF trend.
Targeting again the initial zone at 1.42240

Bearish drop?The Loonie (USD/CAD) has reacted off the pivot and could drop to the 1st support.
Pivot: 1.4274
1st Support: 1.4156
1st Resistance: 1.4325
Risk Warning:
Trading Forex and CFDs carries a high level of risk to your capital and you should only trade with money you can afford to lose. Trading Forex and CFDs may not be suitable for all investors, so please ensure that you fully understand the risks involved and seek independent advice if necessary.
Disclaimer:
The above opinions given constitute general market commentary, and do not constitute the opinion or advice of IC Markets or any form of personal or investment advice.
Any opinions, news, research, analyses, prices, other information, or links to third-party sites contained on this website are provided on an "as-is" basis, are intended only to be informative, is not an advice nor a recommendation, nor research, or a record of our trading prices, or an offer of, or solicitation for a transaction in any financial instrument and thus should not be treated as such. The information provided does not involve any specific investment objectives, financial situation and needs of any specific person who may receive it. Please be aware, that past performance is not a reliable indicator of future performance and/or results. Past Performance or Forward-looking scenarios based upon the reasonable beliefs of the third-party provider are not a guarantee of future performance. Actual results may differ materially from those anticipated in forward-looking or past performance statements. IC Markets makes no representation or warranty and assumes no liability as to the accuracy or completeness of the information provided, nor any loss arising from any investment based on a recommendation, forecast or any information supplied by any third-party.


USDCADusdcad momentum and clear correction with slow accumulation which an explosive reaction to the rise is expected, let's see it together.

USDCAD potential bullish biasThis USDCAD potential bullish bias is likely to play out in a few hours.

Bullish bounce?USD/CAD has bounced off the support level which is a pullback support and could rise from this level to our take profit.
Entry: 1.4297
Why we lik eit:
There is a pullback support level.
Stop loss: 1.4275
Why we like it:
There is a pullback support level that aligns with the 127.2% Fibonacci extension.
Takeprofit: 1.4362
Why we like it:
There is a pullback resistance level that is slightly below the 61.8% Fibonacci retracement.
Enjoying your TradingView experience? Review us!
Please be advised that the information presented on TradingView is provided to Vantage (‘Vantage Global Limited’, ‘we’) by a third-party provider (‘Everest Fortune Group’). Please be reminded that you are solely responsible for the trading decisions on your account. There is a very high degree of risk involved in trading. Any information and/or content is intended entirely for research, educational and informational purposes only and does not constitute investment or consultation advice or investment strategy. The information is not tailored to the investment needs of any specific person and therefore does not involve a consideration of any of the investment objectives, financial situation or needs of any viewer that may receive it. Kindly also note that past performance is not a reliable indicator of future results. Actual results may differ materially from those anticipated in forward-looking or past performance statements. We assume no liability as to the accuracy or completeness of any of the information and/or content provided herein and the Company cannot be held responsible for any omission, mistake nor for any loss or damage including without limitation to any loss of profit which may arise from reliance on any information supplied by Everest Fortune Group.

USDCAD Analysis: Tariff Impact & Technical Outlook
Looking at the USDCAD chart, we've seen interesting price action that I believe presents a trading opportunity.
The significant breakout on February 3rd pushed price above the 1.44 level with strong momentum. This wasn't random - it coincided with increasing tariff speculation, as trade policy uncertainty typically impacts the USD-CAD relationship substantially given their close economic ties.
Currently trading around 1.43, USDCAD has pulled back from recent highs but remains in a solid uptrend, as confirmed by the ascending trendline EMA200 (pink). I'm watching for a potential bounce from current levels, as any new tariff announcements could reignite USD strength.
The COT data shows institutional positioning has decreased recently, but remains net long overall. This suggests big players haven't abandoned their bullish USD outlook despite the recent consolidation.
Key levels I'm monitoring:
Support 1.42 zone
Resistance: Previous high near 1.44-1.45
VRVP shows significant interest around the 1.43-1.44 area
I believe if upcoming tariff news triggers volatility, we could see a retest of range highs with potential for further upside. The fundamentals support continued USD strength in this environment, especially if global uncertainty increases.

USDCAD Ready to Fly SoonUSDCAD should see a massive rise soon. This is due to a bullish flag pattern which has formed on the daily chart. This should be a nice trade heading towards nfp release.

USDCAD INTRADAY rising support retestUSDCAD remains in a bullish trend, supported by the prevailing uptrend. The recent price action indicates a corrective pullback toward a key support zone.
Key Level: 1.4300
This level represents the previous consolidation range and serves as a crucial support area.
Bullish Scenario: A bounce from 1.4300 could reinforce the uptrend, with potential targets at 1.4370, followed by 1.4420 and 1.4490 over the longer term.
Bearish Scenario: A break below 1.4300 with a daily close under this level would weaken the bullish outlook, leading to further declines toward 1.4250, 1.4220, and 1.4180.
Conclusion:
USDCAD remains bullish unless it loses support at 1.4300. Traders should watch for a bounce or a breakdown at this level to determine the next move.
This communication is for informational purposes only and should not be viewed as any form of recommendation as to a particular course of action or as investment advice. It is not intended as an offer or solicitation for the purchase or sale of any financial instrument or as an official confirmation of any transaction. Opinions, estimates and assumptions expressed herein are made as of the date of this communication and are subject to change without notice. This communication has been prepared based upon information, including market prices, data and other information, believed to be reliable; however, Trade Nation does not warrant its completeness or accuracy. All market prices and market data contained in or attached to this communication are indicative and subject to change without notice.

Market Analysis: USD/CAD DipsMarket Analysis: USD/CAD Dips
USD/CAD declined and now consolidates below the 1.4350 level.
Important Takeaways for USD/CAD Analysis Today
- USD/CAD started a fresh decline after it failed to clear the 1.4415 resistance.
- There was a break below a major bullish trend line
USD/CAD Technical Analysis
On the hourly chart of USD/CAD at FXOpen, the pair climbed toward the 1.4420 resistance zone before the bears appeared. The US Dollar formed a swing high near 1.4415 and recently declined below the 1.4350 support against the Canadian Dollar.
There was also a close below the 50-hour simple moving average and 1.4310. There was a break below a major bullish trend line with support at 1.4310.
The bulls are now active near the 1.4300 level. The pair is now consolidating losses below the 23.6% Fib retracement level of the downward move from the 1.4415 swing high to the 1.4288 low. If there is a fresh increase, the pair could face resistance near the 1.4330 level.
The next key resistance on the USD/CAD chart is near the 1.4350 level and the 50% Fib retracement level of the downward move from the 1.4415 swing high to the 1.4288 low.
If there is an upside break above 1.4350, the pair could rise toward the 1.4400 resistance. The next major resistance is near the 1.4415 zone, above which it could rise steadily toward the 1.4450 resistance zone.
Immediate support is near the 1.4290 level. The first major support is near 1.4260. A close below the 1.4260 level might trigger a strong decline. In the stated case, USD/CAD might test 1.4240. Any more losses may possibly open the doors for a drop toward the 1.4400 support.
This article represents the opinion of the Companies operating under the FXOpen brand only. It is not to be construed as an offer, solicitation, or recommendation with respect to products and services provided by the Companies operating under the FXOpen brand, nor is it to be considered financial advice.
