usdcad|foxforexUSDCAD tested the main support area after breaking this area. The next target is the support area located at 1.4200.
USDCAD_LMAX trade ideas

USDCAD-SELL strategy 3 hourly chart The pair is under pressure and broken below a triangle formation, and we are trading below the cloud cover as well.
Strategy SELL @ 1.4360-1.4380 and take profit near 1.4267 for now.

USDCAD.. SELL TRADE SETUP..Here’s a structured analysis of the *USDCAD sell trade setup, assuming the entry is near current market levels (e.g., **1.4300–1.4310*). If the entry differs, adjust calculations accordingly:
---
### *Trade Summary*
- *Entry: *Not specified (Assumed near *1.4300*)
- *Stop Loss (SL): **1.43130* (13 pips risk if entry is 1.4300)
- *Targets*:
1. *1.42400* (-60 pips from 1.4300)
2. *1.41777* (-123 pips from 1.4300)
---
### *Key Analysis*
1. *Risk-Reward Ratios (If Entry = 1.4300)*:
- *Target 1: 60 pips reward vs. 13 pips risk → **4.6:1* (Exceptional).
- *Target 2: 123 pips reward vs. 13 pips risk → **9.5:1* (Very aggressive).
2. *Position Sizing*:
- For a 13-pip SL, ensure alignment with your risk tolerance (e.g., 1–2% of capital).
- Example: For a $

USDCAD SELL SETUPA breakout has been seen on htf narratives. We want to see a reaction from the supply to continue the sell following Price IOF

USDCADUSDCAD
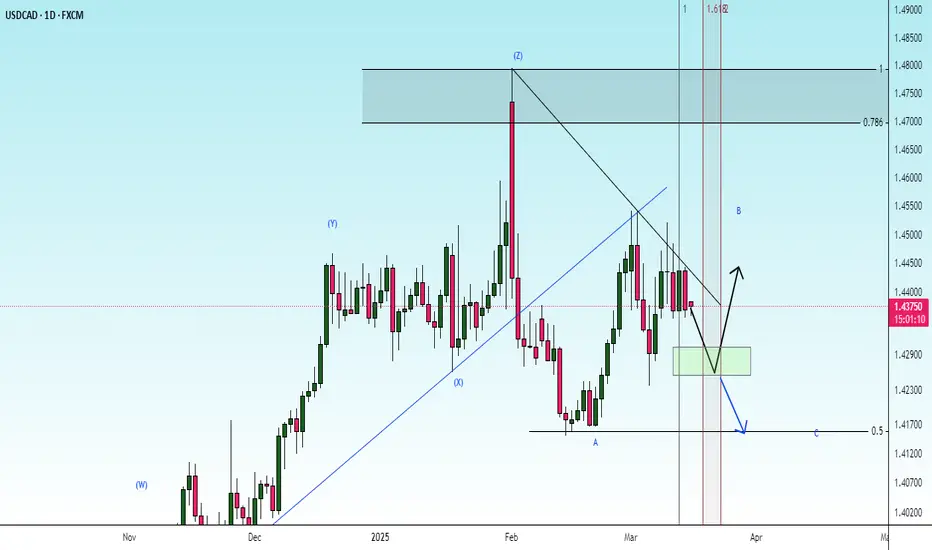
It has almost completed the correction , forming the " c " Corrective Waves from Fibonacci Level - 61.80% in a Corrective Pattern " Symmetrical Triangle ". It has breakout the Lower Trend Line proper Entry after Retracement

Reason why i took USDCAD todayHead n Shoulder pattern spotted out on 1HR , placing my BOS and Order block for my entry,
Patient, discipline and execute fearlessly.

USDCAD ShortUSDCAD short on the regression break.
I am considering my options and which EA to use to get the most out of this setup.

Bearish reversal?The Loonie (USD/CAD) is rising towards the pivot which acts as a pullback resistance and could drop to the 1st support which has been identified as a pullback support.
Pivot: 1.4359
1st Support: 1.4165
1st Resistance: 1.4486
Risk Warning:
Trading Forex and CFDs carries a high level of risk to your capital and you should only trade with money you can afford to lose. Trading Forex and CFDs may not be suitable for all investors, so please ensure that you fully understand the risks involved and seek independent advice if necessary.
Disclaimer:
The above opinions given constitute general market commentary, and do not constitute the opinion or advice of IC Markets or any form of personal or investment advice.
Any opinions, news, research, analyses, prices, other information, or links to third-party sites contained on this website are provided on an "as-is" basis, are intended only to be informative, is not an advice nor a recommendation, nor research, or a record of our trading prices, or an offer of, or solicitation for a transaction in any financial instrument and thus should not be treated as such. The information provided does not involve any specific investment objectives, financial situation and needs of any specific person who may receive it. Please be aware, that past performance is not a reliable indicator of future performance and/or results. Past Performance or Forward-looking scenarios based upon the reasonable beliefs of the third-party provider are not a guarantee of future performance. Actual results may differ materially from those anticipated in forward-looking or past performance statements. IC Markets makes no representation or warranty and assumes no liability as to the accuracy or completeness of the information provided, nor any loss arising from any investment based on a recommendation, forecast or any information supplied by any third-party.

USD/CAD Breakout! Short Opportunity Ahead!Post:
💡 USD/CAD Analysis: The price has broken below the ascending trendline, confirming a bearish trend. Currently, the market is retesting the previous support zone, with a high probability of further downside movement.
📉 Sell Setup:
Entry: 1.43642
Stop Loss: 1.43941 (To avoid market noise)
Take Profit: 1.43089 (Potential support area)
🔎 This setup is ideal for traders who prefer breakout and retest strategies. Keep a close eye on price action to manage the trade effectively!
📊 Personal View: This trade offers a good risk-to-reward ratio, but be cautious of economic news that may cause volatility. What’s your take on this setup? Let’s discuss! 👇

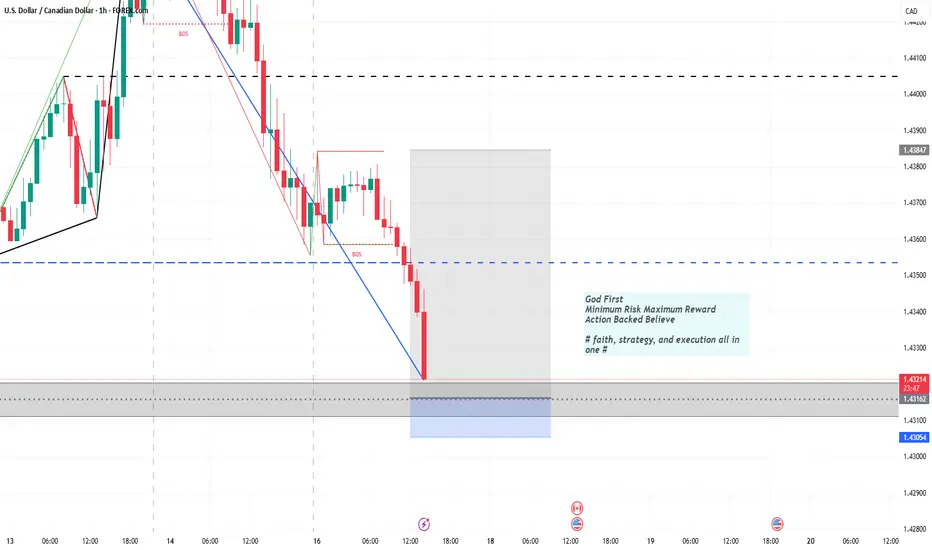
BUYGod First
Minimum Risk Maximum Reward
Action Backed Believe
# faith, strategy, and execution all in one #
USD-CAD Bearish Breakout! Sell!
Hello,Traders!
USD-CAD kept bouncing
Off of the horizontal support
Of 1.4355 but then it was
Finally broken and the breakout
Is Confirmed so we are locally
Bearish biased and we will be
Expecting the pair to go
Further down
Sell!
Comment and subscribe to help us grow!
Check out other forecasts below too!
Disclosure: I am part of Trade Nation's Influencer program and receive a monthly fee for using their TradingView charts in my analysis.

USDCAD - Get Ready Bulls!Hello TradingView Family / Fellow Traders. This is Richard, also known as theSignalyst.
📈USDCAD has been overall bullish trading above the blue trendline acting as a non-horizontal support.
This week, USDCAD has been in a correction phase trading within the falling red channel.
Moreover, the green zone is a strong demand.
🏹 Thus, the highlighted blue circle is a strong area to look for buy setups as it is the intersection of demand and lower red and blue trendlines acting as non-horizontal support.
📚 As per my trading style:
As #USDCAD approaches the blue circle zone, I will be looking for bullish reversal setups (like a double bottom pattern, trendline break , and so on...)
📚 Always follow your trading plan regarding entry, risk management, and trade management.
Good luck!
All Strategies Are Good; If Managed Properly!
~Rich
Disclosure: I am part of Trade Nation's Influencer program and receive a monthly fee for using their TradingView charts in my analysis.

USDCADUsdcad has been doing alot of movement right here im seeing a break and retest of structure ,easy analaysis

USD/CAD Bullish Setup: Key Support Holding for Potential Upside This chart represents a technical analysis of the USD/CAD currency pair on the 1-hour timeframe. Here's a breakdown of the key elements:
Key Indicators & Levels:
Exponential Moving Averages (EMA):
200 EMA (Blue Line): 1.43906 (Long-term trend indicator)
30 EMA (Red Line): 1.43859 (Short-term trend indicator)
Support & Resistance Zones:
Support Zone (Purple Area, Lower): Around 1.43658
Resistance Zone (Purple Area, Upper): Around 1.44500
Trade Setup:
Entry Point: Near 1.43753 (Current Price)
Stop Loss: Below 1.43658 (Red zone at 1.43158)
Take Profit Target: 1.45425 - 1.45433 (Blue zone)
Potential Trade Direction:
The price is expected to bounce from the support zone and move upwards.
A break above the resistance zone (~1.44500) would confirm bullish momentum.
The projected target is 1.45425 - 1.45433.
Conclusion:
Bullish Outlook: If the price respects the support zone and breaks above 1.44500.
Bearish Risk: If the price falls below 1.43658, the setup would be invalid.
EMA Perspective: The price is fluctuating around the 200 EMA, suggesting a potential trend shift.
Would you like a more detailed breakdown or any additional insights

USDCAD eyes bullish bat patternOn the 4-hour chart, USDCAD is in short-term volatility. Currently, you can pay attention to the support below around 1.427, and after it reaches the support, you can pay attention to the potential bullish bat pattern.

check the terndIt is expected that a trend change will form in the current support range and we will see the start of an upward trend.
USDCAD BULLISH MOVE1H TF Shows CHoCH and multiple BoS, which indicates trading going down and then moving upward the bullish way

Bearish drop off pullback resistance?The Loonie (USD/CAD) has reacted off the pivot which has been identified as a pullback resistance and could drop to the 1st support.
Pivot: 1.4475
1st Support: 1.4156
1st Resistance: 1.4736
Risk Warning:
Trading Forex and CFDs carries a high level of risk to your capital and you should only trade with money you can afford to lose. Trading Forex and CFDs may not be suitable for all investors, so please ensure that you fully understand the risks involved and seek independent advice if necessary.
Disclaimer:
The above opinions given constitute general market commentary, and do not constitute the opinion or advice of IC Markets or any form of personal or investment advice.
Any opinions, news, research, analyses, prices, other information, or links to third-party sites contained on this website are provided on an "as-is" basis, are intended only to be informative, is not an advice nor a recommendation, nor research, or a record of our trading prices, or an offer of, or solicitation for a transaction in any financial instrument and thus should not be treated as such. The information provided does not involve any specific investment objectives, financial situation and needs of any specific person who may receive it. Please be aware, that past performance is not a reliable indicator of future performance and/or results. Past Performance or Forward-looking scenarios based upon the reasonable beliefs of the third-party provider are not a guarantee of future performance. Actual results may differ materially from those anticipated in forward-looking or past performance statements. IC Markets makes no representation or warranty and assumes no liability as to the accuracy or completeness of the information provided, nor any loss arising from any investment based on a recommendation, forecast or any information supplied by any third-party.

USD/CAD Analysis
1️⃣ A downtrend has been broken on the daily chart, indicating the beginning of a new uptrend.
2️⃣ There are oversold signals on the RSI and MACD, supporting the possibility of a continued uptrend.
3️⃣ Strong demand zones have been identified, suitable for entering long positions.
Recommendation:
Buy from the blue zones.
Targets are located in the green zones.
It is recommended to observe proper capital management to ensure risk reduction.

CAD is feeling weak—maybe too many Tim Hortons runs?USD/CAD - Bullish Bias
What's Up with CAD?
BoC rate cuts have made CAD as soft as a maple syrup pancake (75bps already cut, more expected!).
U.S. flexing its economy—higher GDP and labor market stability making the USD look like a gym bro.
Trade risks—U.S. tariffs putting extra weight on CAD, dragging it down.
Oil prices on a rollercoaster—falling oil = weaker CAD, pushing USD/CAD higher. (Canada loves oil money, so when oil dips, CAD trips.)
Technical Setup (1H Timeframe)
Support Level Holding Strong around 1.4370-1.4380—buyers stepping in like bouncers at a club.
Resistance Wick at 1.4440-1.4450, where price got slapped down harder than a bad stock pick.
FVG (Fair Value Gap) below support—price might tap it before liftoff.
Moving Averages Drama:
50MA (pink) & 200MA (dark red) sandwiching price like a grilled cheese.
35SMAA (blue & green) showing short-term momentum.

USD/CAD H4 AnalysisAt the end of last week, USD/CAD sat at current 4 hour support at 1.4360
A reversal pattern here next week could lead to a long trade targeting 1.4445 which was the most recent 4 hour resistance.
However, a 4 hour close below 1.43600 could lead to sells with a potential target of 1.4286

Sell usdcadMore sell expected
Respecting the downward channel
Daily and h4 trend broken and retested and close below the fresh sell zone

USDCAD REVIEW AND UPDATEThe Entry point is not Clear yet,Wait for a Small Pattern/Structure and entry for the Sell first and lookout also for the main BUY..ENJOY!!!!
