USD/CAD – High Probability Long SetupHey guys, welcome back! I'm Skeptic, and today I want to share an interesting long setup on USD/CAD that could present a solid trading opportunity. Let's break it down!
📌 1D Timeframe Analysis
After the previous uptrend, USD/CAD entered a long consolidation phase within a daily range.
Recently, we saw a fake breakout of the range low, followed by strong bullish momentum, indicating a potential attempt to break the key resistance at 1.45172.
If this breakout is successful, we could see higher targets being tested.
📌 4H Timeframe & Entry Plan
🔹 Trigger: Entry after the breakout of 1.44545 resistance.
🔹 Execution: You can either place a stop-buy order or wait for a breakout confirmation on lower timeframes.
🔹 Stop-Loss: Below 1.43677 (safe level).
🔹 Target: Holding towards the daily resistance at 1.45172 and beyond.
📌 Why take this trade?
We are anticipating the daily breakout before it happens, rather than chasing it after the fact.
If you wait for confirmation above 1.45172, you may need a wider stop-loss, making the entry less favorable due to increased volatility.
📉 Risk management remains key! Make sure to size your position accordingly and avoid overleveraging.
💬 What’s your take on this USD/CAD setup? Drop your thoughts below!
🚀 See you in the next analysis!
USDCAD_LMAX trade ideas

Bullish bounce?USD/CAD is falling towards the support level which is a pullback support that lines up with the 38.2% Fibonacci retracement and could bounce from this level to our take profit.
Entry: 1.4360
Why we like it:
There is a pullback support level that lines up with the 38.2% Fibonacci retracement.
Stop loss: 1.4307
Why we like it:
There is a pullback support that is slightly below the 50% Fibonacci retracement.
Take profit: 1.4486
Why we like it:
There is a pullback resistance level which is a pullback resistance that is slightly above the 50% Fibonacci retracement.
Enjoying your TradingView experience? Review us!
Please be advised that the information presented on TradingView is provided to Vantage (‘Vantage Global Limited’, ‘we’) by a third-party provider (‘Everest Fortune Group’). Please be reminded that you are solely responsible for the trading decisions on your account. There is a very high degree of risk involved in trading. Any information and/or content is intended entirely for research, educational and informational purposes only and does not constitute investment or consultation advice or investment strategy. The information is not tailored to the investment needs of any specific person and therefore does not involve a consideration of any of the investment objectives, financial situation or needs of any viewer that may receive it. Kindly also note that past performance is not a reliable indicator of future results. Actual results may differ materially from those anticipated in forward-looking or past performance statements. We assume no liability as to the accuracy or completeness of any of the information and/or content provided herein and the Company cannot be held responsible for any omission, mistake nor for any loss or damage including without limitation to any loss of profit which may arise from reliance on any information supplied by Everest Fortune Group.

USD/CAD LongIncoming pullback on Usd/Cad Cad is weak and there are no signs that it will turn in near future. I'm looking to go long on this pair and aim for highs at 1.47880
Wait for price to come closer to support around 1.3400 before going long.


USDCAD H4 Short This tool points us to a downtrend. In addition, fundamental data indicates that the price is falling to significant levels.

correctionIt is expected that the continuation of the upward trend will proceed according to the specified paths and grow to the specified Fibonacci levels. Then there is a possibility of a trend change and the start of a correction.

Bullish continuation?The Loonie (USD/CAD) is falling towards the pivot which has been identified as a pullback support and could bounce to the 1st resistance that lines up wit the 61.8% Fibonacci retracement.
Pivot: 1.4348
1st Support: 1.4239
1st Resistance: 1.4537
Risk Warning:
Trading Forex and CFDs carries a high level of risk to your capital and you should only trade with money you can afford to lose. Trading Forex and CFDs may not be suitable for all investors, so please ensure that you fully understand the risks involved and seek independent advice if necessary.
Disclaimer:
The above opinions given constitute general market commentary, and do not constitute the opinion or advice of IC Markets or any form of personal or investment advice.
Any opinions, news, research, analyses, prices, other information, or links to third-party sites contained on this website are provided on an "as-is" basis, are intended only to be informative, is not an advice nor a recommendation, nor research, or a record of our trading prices, or an offer of, or solicitation for a transaction in any financial instrument and thus should not be treated as such. The information provided does not involve any specific investment objectives, financial situation and needs of any specific person who may receive it. Please be aware, that past performance is not a reliable indicator of future performance and/or results. Past Performance or Forward-looking scenarios based upon the reasonable beliefs of the third-party provider are not a guarantee of future performance. Actual results may differ materially from those anticipated in forward-looking or past performance statements. IC Markets makes no representation or warranty and assumes no liability as to the accuracy or completeness of the information provided, nor any loss arising from any investment based on a recommendation, forecast or any information supplied by any third-party.

USDCAD H4The price break our down channel and creat a CHOCH thats main the price is now in up trend
and we have a strong zone if the price come back to we take long to the next supply zone
LR

MEASURED MOVE USD/CADCharting a measured move to the upside in USD/CAD with substantial upside potential.

USDCAD - Long after filling the imbalance !!Hello traders!
‼️ This is my perspective on USDCAD.
Technical analysis: Here we are in a bullish market structure from 4H timeframe perspective, so I look for a long. I expect upcoming week price to make a retracement to fill that huge imbalance lower and then to reject from bullish OB.
Fundamental news: Upcoming week on Friday (GMT+2) we have NFP on USD and Unemployment Rate on CAD. News with high impact on currencies.
Like, comment and subscribe to be in touch with my content!

USD/CAD Technical Analysis: Bullish Momentum with 3:1 RR LongUSD/CAD Technical Analysis: Bullish Momentum with 3:1 Risk-Reward Long Opportunity
Current Market Structure
USD/CAD is displaying a strong bullish trend across multiple timeframes, with price action forming higher lows and higher highs since mid-February 2025. Analysis reveals:
Daily timeframe: Clear uptrend developing from the late 2024 lows with price breaking above previous resistance
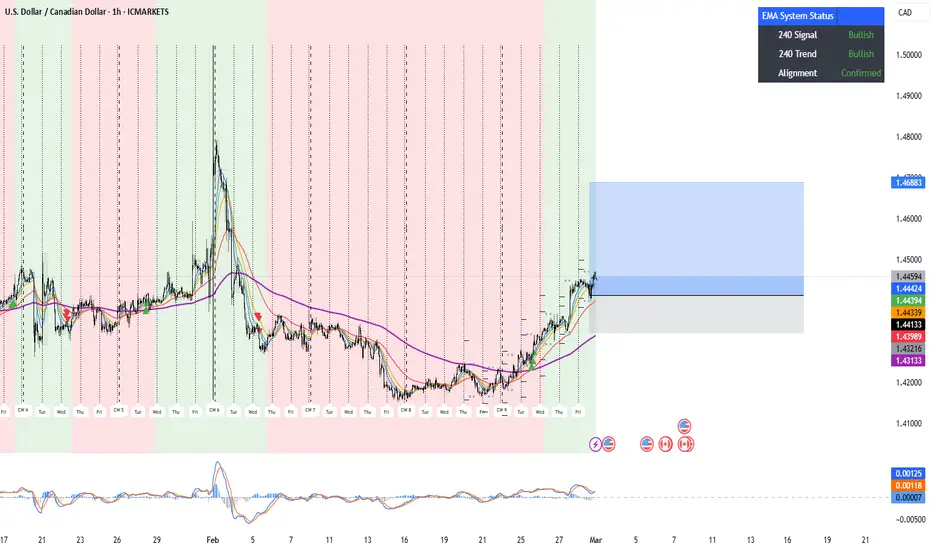
4-hour timeframe: "Confirmed" bullish alignment with all EMAs in a clean bullish stack (8 > 13 > 21 > 55)
1-hour timeframe: Similar bullish configuration providing additional confirmation
EMA System Status Confirmation
The proprietary EMA System Status indicator shows robust bullish conviction:
240 Signal: Bullish
240 Trend: Bullish
Alignment: Confirmed
This triple confirmation represents ideal conditions for long entries according to our system parameters.
Key Technical Levels
Support Levels:
1.4321: Current stop placement and recent support zone
1.4260: Previous consolidation area
1.4200: Psychological round number
Resistance Levels:
1.4500: Psychological round number
1.4688: Current profit target and projected resistance
1.4750: Major resistance from historical price action
Correlation Analysis
The bullish USD/CAD setup is reinforced by:
Strengthening DXY (Dollar Index) with confirmed bullish alignment
Oil price vulnerability affecting CAD's strength
Diverging monetary policy expectations between Fed and BoC
These correlations provide additional confirmation for the USD/CAD long position.
Trade Parameters
Entry Strategy:
Long at 1.44133
Stop Loss at 1.43216 (91.7 pips)
Profit Target at 1.46883 (275.0 pips)
Risk/Reward Ratio: 1:3 RR
Risk Management:
0.35% account risk allocation ($100,000 account)
1.0 lot position size
$350 risk per trade
Potential profit: $1,049.62
Technical Confluence Factors
Multiple technical factors support this long setup:
Price recently pulled back to and bounced from the 21 EMA support
All EMAs aligned in bullish stack formation (8 > 13 > 21 > 55 > 200)
MACD showing bullish momentum and confirmation
Weekly and daily separators providing context for key support/resistance zones
Recent break above previous swing high resistance
Market Timing Considerations
Important events to monitor that may impact this trade:
Bank of Canada interest rate decisions
Canadian employment and inflation reports
US Federal Reserve policy statements
Oil price movements (inverse correlation to USD/CAD)
Conclusion
USD/CAD presents a high-probability long opportunity with an excellent risk-reward ratio of 3:1.
The technical picture shows strong bullish momentum across all relevant timeframes with the EMA system providing "Confirmed" alignment status. This setup meets our strict criteria for trade execution.
Trade management will follow our established methodology with partial profit taking at the 1.5R mark and trailing stops implemented once price exceeds the 2:1 risk-reward threshold.
#USDCAD #forex #technicalanalysis #EMAsystem #bullishsetup #tradingopportunity #riskmanagement #DXYcorrelation #currencytrading #longtrade #swingtrading #tradingsystem #forexanalysis #tradingview #priceaction #EMAsignals #tradingsetup #riskreward #tradingstrategy #BankofCanada #FederalReserve
USDCAD SHORTShort Trade Setup:
📌 Entry Zone:
• Look for a bearish confirmation candle around 1.4450 - 1.4480 before entering a short position.
• A retest of the resistance level would provide stronger confirmation.
🎯 Target Price (TP):
• TP1: 1.4300 – First key support level
• TP2: 1.4150 – Lower boundary of the channel
🚨 Stop Loss (SL):
• SL: Above 1.4500, in case the price breaks out above resistance.
This setup is valid as long as the resistance level holds and no breakout occurs. Always wait for confirmation before entering a trade

USDCAD Will Fall! Sell!
Here is our detailed technical review for USDCAD.
Time Frame: 3h
Current Trend: Bearish
Sentiment: Overbought (based on 7-period RSI)
Forecast: Bearish
The market is trading around a solid horizontal structure 1.445.
The above observations make me that the market will inevitably achieve 1.435 level.
P.S
The term oversold refers to a condition where an asset has traded lower in price and has the potential for a price bounce.
Overbought refers to market scenarios where the instrument is traded considerably higher than its fair value. Overvaluation is caused by market sentiments when there is positive news.
Like and subscribe and comment my ideas if you enjoy them!

USDCAD SELL ANALYSIS SMART MONEY CONCEPT Here on Usdcad price has form a supply around area of 1.44489 and is likely to continue moving down as more sellers are likely to come and push the price down so trader should go for short with expect profit target of 1.43558 and 1.42562 . Use money management


USDCAD BUY TRADE PLAN WITH ALTERNATE PLAN🔵 Primary Trade Setup – Bullish Reversal Buy
📍 Primary Entry Zone (Zone 1):
🔷 Buy Limit: 1.4325 – 1.4350 (First institutional entry at OB/S&D zone 🏦)
📍 Stop Loss:
🚫 SL: Below 1.4280/50 (Institutional SAFE Zone – Avoids Stop Hunts 🛑)
📍 Take Profits:
🎯 TP1: 1.4380 (Internal Liquidity Reaction 📉)
🎯 TP2: 1.4450 (Liquidity Grab Confirmation 💰)
🎯 TP3: 1.4500 (Final Institutional Target 🚀)
📍 Trade Type & Confidence:
📊 Type: Swing Trade / Intraday (Valid for 3–5 Days) ⏳
💎 Confidence Level: VERY HIGH 🔥 (Optimized Liquidity Grab Zone & OB Confluence).
📍 Execution Strategy:
✅ Aggressive Entry: Pending Buy Limit Order at 1.4325 – 1.4350.
✅ Deeper Entry (Optional): If liquidity sweeps further, Buy Limit at 1.4280 – 1.4300.
🔍 Safe Entry: Wait for M15/H1 bullish rejection after liquidity grab before entering.
⚠ Invalidation: If price breaks below 1.4250 with strong bearish momentum ❌
ALTERNATE:
🔴 Secondary Trade Setup – Bearish Liquidity Grab Sell
📍 Entry Zone:
🟥 Sell Limit: 1.4505 – 1.4530
📍 Stop Loss:
🚫 SL: Above 1.4550 (Institutional SAFE Zone)
📍 Take Profits:
🎯 TP1: 1.4460 (Internal liquidity reaction 📈)
🎯 TP2: 1.4400 (Key discount zone 💵)
🎯 TP3: 1.4350 (Final deep discount target 🔽)
📍 Trade Type & Confidence:
📊 Type: Intraday / Short-Term Swing (Valid for 24–48 Hours) ⏳
💎 Confidence Level: HIGH 🔥 (Liquidity grab dependent, Smart Money re-entry zone).
📍 Execution Strategy:
✅ Aggressive Entry: Pending Sell Limit Order at 1.4505–1.4530.
🔍 Safe Entry: Wait for M15/H1 bearish rejection after liquidity grab before selling.
⚠ Invalidation: If price closes above 1.4550 with bullish momentum ❌

yummy USDCAD setupAlong with my bearish bias on DXY, I'm targeting the liquidity downside on the CAD.
2.5 RR but keep in mind runners have a possibility to dump waaay lower. We have room to the downside...
OK be safe byyyy

USDCAD ANALYSIS FOR UPCOMING WEEKI will be looking for SELL positions this upcoming week. Market is approaching the Golden Zone also known as the area from the 50-61.8% Fibonacci Retracement Level. It does have potential to drop now but I'd prefer to wait a little longer for a higher probability, however you may trade as you intend. The "Sniper" entry would be the best entry with best R:R. The stop loss and Take profit levels intend to stay the same, I recommend a trailing stop and multiple entry's when necessary. Enjoy your WEEK traders, hope this was helpful.

USDCAD Under Pressure! SELL!
My dear subscribers,
USDCAD looks like it will make a good move, and here are the details:
The market is trading on 1.4439 pivot level.
Bias - Bearish
My Stop Loss - 1.4484
Technical Indicators: Both Super Trend & Pivot HL indicate a highly probable Bearish continuation.
Target - 1.4352
About Used Indicators:
The average true range (ATR) plays an important role in 'Supertrend' as the indicator uses ATR to calculate its value. The ATR indicator signals the degree of price volatility.
———————————
WISH YOU ALL LUCK

USDCAD POTENTIAL LONGThe pair is bullish on weekly and daily charts and has made a structure break on daily. Look for a pullback in the FVG on daily chart, and then a structure break on smaller time frame for Long.

quant zones for friday US and CAD dataCheck out our socials for some nice insights.
Let us know if there're any pair you like to see or if this is something you like.
Do ask if you have any question
Not as refined as our direct trade setups. More for advanced active traders.
information created and published doesn't constitute investment advice!
NOT financial advice
quant zones for friday
already in shorting zone
if US data and cad data spiked it higher even better for shorting.

Trump’s Tariff Threat: USD/CAD Hits Three-Week HighTrump’s Tariff Threat: USD/CAD Hits Three-Week High
As we reported on 3 February, Trump’s tariffs pushed USD/CAD to a 22-year high.
However, a one-month tariff delay led to a sharp drop, sending USD/CAD to its 2025 low near 1.41550. As the end of the delay approaches, the pair has been climbing again since mid-February (as shown by the arrow).
Yesterday, President Trump confirmed that his proposed 25% tariffs on Mexican and Canadian goods will take effect on 4 March. This dashed hopes for another delay and triggered a breakout above the 1.43600 resistance level.
Technical Analysis of USD/CAD
Above current levels, key resistance lies at 1.44600, which has held firm since mid-December. However, drastic measures from Trump’s administration could drive further price movement within the blue-marked channel.
Expect volatility spikes ahead of Canada’s GDP release, scheduled for today at 16:30 GMT+3.
Trade on TradingView with FXOpen. Consider opening an account and access over 700 markets with tight spreads from 0.0 pips and low commissions from $1.50 per lot.
This article represents the opinion of the Companies operating under the FXOpen brand only. It is not to be construed as an offer, solicitation, or recommendation with respect to products and services provided by the Companies operating under the FXOpen brand, nor is it to be considered financial advice.

USDCAD: Back to Bullish Trend 🇺🇸🇨🇦
USDCAD is going to continue rising after a confirmed breakout
of a significant daily resistance.
Goals: 1.45 / 1.46
❤️Please, support my work with like, thank you!❤️
