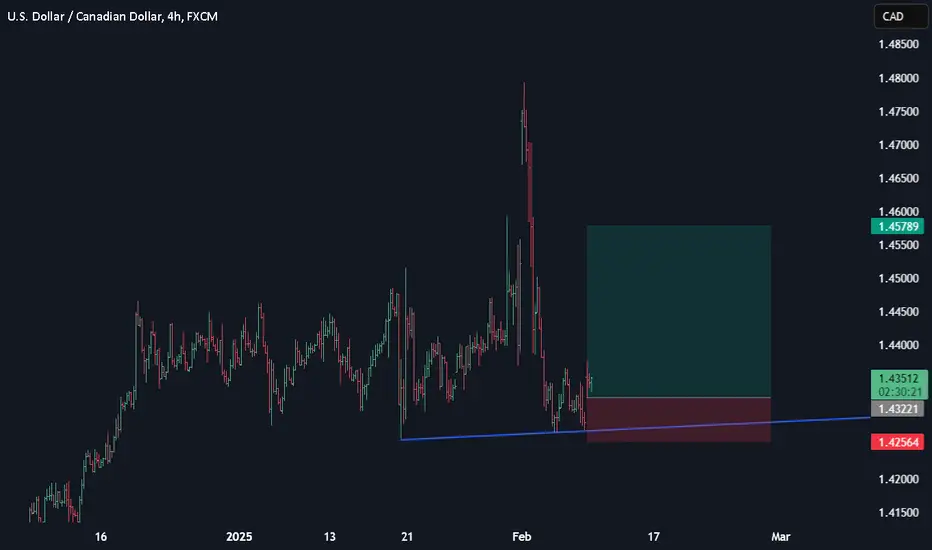
LONG TRADE SPECULATION ON USDCADPreviously, my analysis was short-biased , till after the market opened with the (value) gap, above the resistance level to for a new support, waiting to confirm a buy opportunity.
USDCAD_LMAX trade ideas

USDCAD: Bearish Movement Will Continue 🇺🇸🇨🇦
I think that USDCAD will continue falling soon in an attempt
to close the gap up opening.
Goal - 1.43
❤️Please, support my work with like, thank you!❤️

AUDUSD 1H Chart BUY SIGNALHey everyone! Welcome back to another market update. Today, we’re looking at the USD/CAD pair on the 1-hour timeframe, using Heikin Ashi candles. Let’s break down a potential trade setup with a solid entry, stop loss, and take profit.
Right now, price is sitting around 1.43380, which is a key support zone. We’ve seen some consolidation here, and if buyers step in, we could see a strong push to the upside. So, I’m looking to enter a long position around 1.43380.
Now, risk management is key. My stop loss is placed at 1.41749, just below the recent support. This ensures that if the trade goes against us, we’re protected.
On the upside, my target is set at 1.48052, aiming for a solid risk-to-reward ratio. If price breaks above 1.45626, it could gain momentum, pushing us toward our profit target.
I’ll also be watching volume—if we see increasing bullish volume, that’s further confirmation that buyers are in control. If the trade moves in our favor, I might trail my stop loss to lock in profits.
That’s the plan! Let me know your thoughts in the comments, and don’t forget to like and subscribe for more trade setups. Happy trading!"

USD/CAD BUYING OPPORTUNITY.i'm waiting for a buying opportunity here on the USD/CAD because i believe its continuing the bullish movement and it has also broke out from a descending triangle on a 4H and retested it and it currently has good bullish momentum.

USD/CAD "The Loonie" Forex Market Bullish Heist PlanDear Money Makers & Robbers, 🤑 💰
Based on 🔥Thief Trading style technical and fundamental analysis🔥, here is our master plan to heist the USD/CAD "The Loonie" Forex market. Please adhere to the strategy I've outlined in the chart, which emphasizes long entry. Our aim is the high-risk Red Zone. Risky level, overbought market, consolidation, trend reversal, trap at the level where traders and bearish robbers are stronger. Be wealthy and safe trade.💪🏆🎉
Entry 📈 : "The heist is on! Wait for the breakout (1.45100) then make your move - Bullish profits await!"
however I advise placing Buy limit orders within a 15 or 30 minute timeframe. Entry from the most recent or closest low or high level should be in retest.
Stop Loss 🛑: Using the 4H period, the recent / nearest low or high level.
Goal 🎯: 1.48000 (or) Escape Before the Target
Scalpers, take note 👀 : only scalp on the Long side. If you have a lot of money, you can go straight away; if not, you can join swing traders and carry out the robbery plan. Use trailing SL to safeguard your money 💰.
📰🗞️Fundamental, Macro, Sentimental Outlook:
🟣 Fundamental and Macroeconomic Analysis
US Dollar (USD):
The USD remains strong due to the Federal Reserve's hawkish stance. The Fed has signaled potential rate hikes or prolonged higher rates to combat inflation, which supports the USD.
Recent US economic data (e.g., strong labor market, resilient GDP growth) reinforces the Fed's tightening bias.
Upcoming US CPI and PPI data will be critical. Higher-than-expected inflation could further boost the USD.
Canadian Dollar (CAD):
The CAD is influenced by oil prices (Canada is a major oil exporter). Crude oil prices have been volatile due to geopolitical tensions and OPEC+ production cuts, but recent stabilization around
80−85/barrel provides some support.
The Bank of Canada (BoC) has paused rate hikes, citing slowing inflation and economic growth. This dovish stance weakens the CAD relative to the USD.
Canada’s upcoming employment and GDP data will be key. Weakness in these metrics could further weigh on the CAD.
Key Drivers:
Interest Rate Differential: The Fed’s hawkishness vs. the BoC’s dovishness favors USD strength.
Oil Prices: A sustained rise in oil prices could support the CAD, but current levels are not enough to offset USD strength.
Economic Data: Strong US data vs. weaker Canadian data could widen the USD/CAD upside.
🟢 Commitments of Traders (COT) Report
The latest COT data shows:
Commercial Traders (Hedgers): Increasing long positions in the CAD, suggesting they expect some CAD strength or USD weakness in the medium term.
Non-Commercial Traders (Speculators): Net long on USD, reflecting bullish sentiment toward the USD.
Retail Positioning: Retail traders are heavily short on USD/CAD, which often acts as a contrarian indicator, suggesting further upside potential for USD/CAD.
🔵 Market Sentiment and Positioning
Sentiment:
The market is broadly bullish on the USD due to the Fed’s stance and strong US economic data.
The CAD is viewed as vulnerable due to the BoC’s pause and reliance on oil prices, which are not currently providing enough support.
🟤 Positioning:
Institutional investors are net long USD/CAD, aligning with the fundamental outlook.
Retail traders are net short, which could lead to a squeeze higher if the USD continues to strengthen.
🔴 Market Sentiment and Positioning:
COT Data:
Non-commercial traders (speculators) are net long on USD, reflecting bullish sentiment.
Retail traders are net short on USD/CAD, which often acts as a contrarian indicator (bullish for USD/CAD).
Institutional Positioning:
Institutional investors are net long USD/CAD, aligning with the fundamental outlook.
⚠️Trading Alert : News Releases and Position Management 📰 🗞️ 🚫🚏
As a reminder, news releases can have a significant impact on market prices and volatility. To minimize potential losses and protect your running positions,
we recommend the following:
Avoid taking new trades during news releases
Use trailing stop-loss orders to protect your running positions and lock in profits
📌Please note that this is a general analysis and not personalized investment advice. It's essential to consider your own risk tolerance and market analysis before making any investment decisions.
📌Keep in mind that these factors can change rapidly, and it's essential to stay up-to-date with market developments and adjust your analysis accordingly.
💖Supporting our robbery plan will enable us to effortlessly make and steal money 💰💵 Tell your friends, Colleagues and family to follow, like, and share. Boost the strength of our robbery team. Every day in this market make money with ease by using the Thief Trading Style.🏆💪🤝❤️🎉🚀
I'll see you soon with another heist plan, so stay tuned 🤗

USDCAD on 1h time frame . Testing historical Resistance levelsUSDCAD 1H Analysis – February 10, 2025
📈 Potential Bullish Reversal
The chart shows a double bottom formation near 1.4280, which is a strong bullish reversal pattern.
Price has bounced from this level, suggesting a possible upward move.
📊 Key Resistance Zones to Watch:
1.4550 - 1.4570 → First key resistance (previous support turned resistance).
1.4780 - 1.4800 → Major resistance area where price previously rejected strongly.
🔍 Trading Outlook:
A break above 1.4350 could confirm the bullish momentum.
If price clears 1.4550, the next target would be 1.4800.
A rejection from resistance zones could lead to another decline.
📌 Conclusion: USDCAD is forming a potential bullish structure, but confirmation of a breakout above 1.4550 is needed before expecting further upside. 🚀

USD/CADSell after bearish candle stick pattern, buy after bullish candle stick pattern....
Best bullish pattern , engulfing candle or green hammer
Best bearish pattern , engulfing candle or red shooting star
NOTE: IF YOU CAN'T SEE ANY OF TOP PATTERN IN ZONE DO NOT ENTER
Stop lost before pattern
R/R 1/3
Trade in 5 Min Timeframe, use signal for scalping

bearish engulfing barWith the formation of
bearish engulfing bar candlestick
of the previous week candle, i suppose
its gonna be a sell for the next two or three weeks

USDCAD SELL ANALYSIS BEARISH FLAG PATTERN Here on Usdcad price has form bearish flag and is likely to continue moving down if line 1.42591 break so trader should go for short with expect profit target of 1.40202 and 1.37725 . Use money management

USD/CAD may rise to 0.44005 - 0.44350Preference
Long positions above 0.42937 with targets at 0.44005 and 0.44350 in extension.
Alternative
If below 0.42937 look for further downside with 0.42676 and 0.42355 as targets.

possibility of downtrendConsidering the price behavior in the current resistance level, possible scenarios have been identified. If the price cannot stabilize above the resistance level, the downward trend will likely continue.

USD/CAD – Anticipating a Key Support BreakoutCore Idea:
A breakout below the key support zone at 1.4250 – 1.4245 is anticipated, with further downside momentum expected. The current price consolidation near this support suggests weakening bullish pressure.
Technical Justification:
• Support Zone: 1.4250 – 1.4245
• Expected Scenario: After breaking this zone, the price is likely to move towards 1.4180 and further down to 1.4120.
• Invalidation Level: If the price rebounds above 1.4305, the breakout scenario will be invalidated.
Trading Strategy:
• Sell Stop below 1.4245 to confirm the breakout.
• Take Profit 1: 1.4180
• Take Profit 2: 1.4120
• Stop Loss: 1.4305
Conclusion:
The consolidation around the support indicates position accumulation ahead of a potential breakout. Placing a Sell Stop order will allow you to capitalize on this momentum with a precise market entry.

CAD: Skating on thin iceTariffs on Canada have been delayed for now, and USD/CAD has weakened back to mid-December levels. Our economists suspect these tariffs will be pushed back again before March 4, but see the risk that the President ultimately follows through with these tariffs as higher for Canada than for Mexico. Canada’s parliamentary stand-still, upcoming election, and political transition make a longer-term resolution with the US less certain than with Mexico.
We think these risks mean that markets need to price a higher and more lasting tariff premium in USD/CAD. While tariffs are not our base case, markets have most likely gone too far towards unwinding the tariff premium since the extension.
Options markets are placing a 25% probability on USD/CAD reaching Monday’s intraday highs over the next 3 months, and only a 10% chance of reaching 1.50. Meanwhile, we think that the risk of tariffs on Canada is closer to 40%, so these probabilities seem low by comparison.
Long USD/CAD has performed quite well as a hedge when tariff risks escalate; we continue to think that it is a good option for investors looking for protection from increased trade tensions.
Usd/jpy longI believe it can go up until the next 2h band , if it comes down here i go long from here..

Canadian and US Employment Data: A Comparative AnalysisCanadian and US Employment Data: A Comparative Analysis
Today, two of the world's major economies are scheduled to release their employment data.
Bank of Canada is expected to report a Net Change in Employment for January at 25,000, down from 90,900 in the previous month.
Meanwhile, the US will release the Nonfarm Payrolls (NFP) data for January, with expectations set at 170,000, compared to 256,000 previously.
Here are potential scenarios and their implications:
Both Countries Miss Expectations: If both Canada and the US miss their respective employment data expectations, USDCAD may remain relatively unchanged.
Higher CAD Employment Data, NFP In Line with Expectations: Should the Canadian employment data exceed the previous month's figures while the NFP data meets expectations, USDCAD might move downwards.
NFP Above Expectations: If the NFP data surpasses expectations, we may see USDCAD rising further, impacting the exchange rate more significantly.
As of now, USDCAD is still within its pattern, indicating potential for further growth. Stay tuned to see how the data unfolds and impacts the markets.
You may find more details in the chart!
Thank you and Good Luck!
❤️PS: Please support with a like or comment if you find this analysis useful for your trading day❤️
Disclosure: I am part of Trade Nation's Influencer program and receive a monthly fee for using their TradingView charts in my analysis.

USDCAD FORECASTThe higher timeframe is looking crazy, guys. As we have seen, the price has broken the highest high, and the way that the price grabbed liquidity and closed below is quite a strong indication that more selling potential is coming our way to the downside. What we need to wait for is the completion of the structure that is developing in the lower timeframe. As always, guys, patience is key!

USDCADWe have a down trend on the HTF and now is near supply zone if show as a confirmation we go down
LR

Canadian dollar holds firm on strong jobs data | FX ResearchMarkets are already showing signs of recovery after the sharp risk-off gap lower. The market selloff around tariffs appears overstated, likely exacerbated by thin trading conditions.
Recent U.S. tariff actions could be scaled back as negotiations progress, and markets tend to fill open gaps. The Canadian dollar saw significant weakness, hitting its lowest level against the U.S. dollar since 2003, prompting countermeasures from Canada.
The euro faced additional downside pressure following weaker-than-expected German industrial production data, while the Canadian dollar held up well, supported by a stronger-than-expected Canadian jobs report.
Key events to watch on Monday include an ECB speech by Christine Lagarde, the Bank of Canada’s Market Participant Survey, and US consumer inflation expectations.
Exclusive FX research from LMAX Group Market Strategist, Joel Kruger

USD/CAD🇺🇸🇨🇦 Support and Resistance Levels:
- *Support Level:* Approximately 1.42611, as it was a recent low point and seems to be holding during pullbacks.
-
- *Resistance Level:* Around 1.47937, indicated by the peak where the price reversed before the drop.
These levels are important as they provide thresholds where price actions may reverse. If the price approaches the support level, it may bounce back, and if it tests the resistance level, it may face selling pressure.
Gradual Buy and Sell Points:
- *Buy Level:* Near the support level of 1.42611 can be a strategic point for long-term investors, as buying here might capitalize on a potential bounce back.
- *Sell Level:* Close to the resistance around 1.47937, as prices tend to struggle to break significantly above this point.
The strategy could involve accumulating positions as prices near support and placing sell orders around resistance.
margin trading:
- *Position:* A long position could be taken if the price approaches the support level and holds
- *Entry Point:* Around 1.42611.
- *Take Profit Level:* Target around 1.46000 to 1.47000, slightly below the identified resistance
- *Stop-loss Level:* Set below support at 1.42500 to minimize losses if the support level fails.
*Risk/Reward Ratio:* With a potential gain of approximately 300-400 pips and a risk of around 100-150 pips, the risk-reward ratio would be favorable, at least 2:1.
Indicator Analysis:
The chart shows some indicators, likely Bollinger Bands and moving averages:
- *Bollinger Bands:* Prices are near the lower band, indicating potential for a rebound. The current squeeze suggests low volatility, which could precede a breakout.
-
- *Moving Averages:* If there's a crossover (which isn't visible here), it could signal a shift in momentum.

SHORT ENTRY SPECULATIONHi traders, this is my opinion on the USDCAD. As the price is currently around the ATH, the sellers emerged strongly on the previous week to the point that the price has broken the support level on the Daily Time Frame, waiting patiently for the short pull back confirm the fair value gap, for a selling opportunity. Let me know your idea or opinion about this, Wishing you all a profitable week.

USDCAD - LONG. Target # 1 & Target # 2 - Achieved.
Now heading for Target # 3
Break is over, heading for next level.
Bullish Engulfing
USD - strength plus
Heading for Next Level - USDCAD
Do Your Own Due Diligence.
Education Purpose Only.
FX:USDCAD

USDCAD about to drop for more than 150+ pipsBased on my quantum algorithms USDCAD will drop for 150+ pips

Sell usdcadStrong selling pressure weekly and daily bearish confirmation
Monthly sell setup
Monthly overbought zone
