Trump proposes Canada to become the 51st stateOn February 1 , Donald Trump signed an executive order imposing 25% tariffs on imports from Mexico and Canada, along with 10% tariffs on Chinese goods. In response, Canada announced retaliatory tariffs of 25% on $155 billion worth of U.S. goods, with an initial phase of $30 billion taking effect on February 4. Mexico also implemented counter-tariffs. Trump reaffirmed his intention to impose tariffs on European imports but did not specify the details.
On February 2 , Trump stated that if Canada wants to avoid tariffs and taxes, it should become the 51st state of the United States. He argued that the U.S. should not be subsidizing Canada with hundreds of billions of dollars, as the country does not rely on Canadian resources. According to Trump, the U.S. has “unlimited energy resources,” sufficient timber supplies, and a growing domestic automobile industry. He added that without U.S. subsidies, Canada would struggle to remain economically viable, whereas joining the U.S. would provide lower taxes, better military protection, and exemption from tariffs.
On February 3 , during the European session, the following market trends were observed:
U.S. stock futures declined by 1.5–2.5%. The U.S. Dollar Index rose 1%, reaching 109.50. EUR/USD opened with a major bearish gap, dropping to 1.0210, losing over 1%.
GBP/USD fell below 1.2250 due to dollar strength.
In Australia, December retail sales fell by 0.1%, which was better than expected but failed to support the AUD. As a result, AUD/USD dropped 1.2%, falling below 0.6100.
USD/CAD surged significantly to 1.4792, the highest level since 2003.
USD/MXN hit 21.2882, marking a three-year high.
After reaching a record $2,800 on Friday, gold corrected lower on Monday, trading below $2,775.
USDCAD_LMAX trade ideas
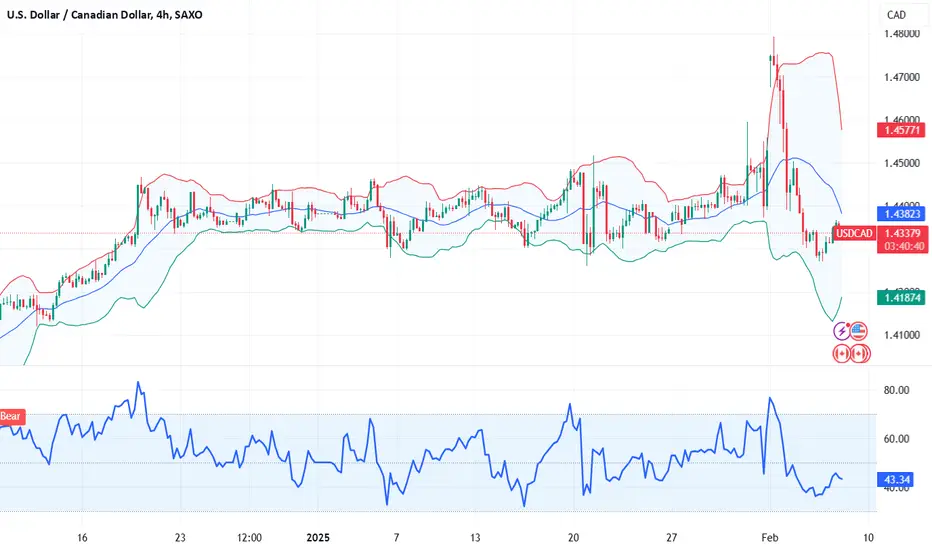
Upward retestDollar Cad, managed to show bullish strength after breaking through the 1.44000 mark, after having anticipated a potential drop. As price dropped after reaching the above high, price action is stabilising above the 1.43500 with an attempt to retest the above highs.
Settling above the 1.44000 and 1.44600 may yield to a continued rise. However, if the pair fails to rise and declines below the 1.43500, it may drop in search of bullish pressure.

Bullish USD-CAD for all 2025?Based on the pattern drafted on the graph, I expect patterns to repeat itself. If the long term resistance line (blue) is broken with 1M candle (closed above), the rally will gain further momentum. Good ratio of profit and loss.
Note that this is a long term prediction on 1M candle chart.

USD/CAD Exchange Rate StabilisesUSD/CAD Exchange Rate Stabilises
As we reported on 3 February, the decision by the US president to impose 25% tariffs on goods imported from Canada sent the USD/CAD rate soaring to a 22-year high.
However, after a round of negotiations between Donald Trump and Justin Trudeau, the tariff implementation was postponed by a month, which was reflected in the USD/CAD exchange rate chart.
Current USD/CAD Chart Analysis:
→ The price has retreated from the upper boundary of the ascending channel identified three days ago and has now dropped below its lower boundary.
→ The price has returned to and remains within the broad 1.4270 – 1.4460 range.
→ The ATR indicator has reversed from its peak and is trending downward.
Given these factors, it is reasonable to say that USD/CAD is stabilising after recent volatility. But what lies ahead?
The exchange rate may fluctuate within the 1.4270 – 1.4460 range, reacting sensitively to any news on Trump’s tariff policies and his startling suggestion of making Canada the 51st US state.
Trade on TradingView with FXOpen. Consider opening an account and access over 700 markets with tight spreads from 0.0 pips and low commissions from $1.50 per lot.
This article represents the opinion of the Companies operating under the FXOpen brand only. It is not to be construed as an offer, solicitation, or recommendation with respect to products and services provided by the Companies operating under the FXOpen brand, nor is it to be considered financial advice.

USD/CAD H1 | Approaching pullback resistanceUSD/CAD is rising towards a pullback resistance and could potentially reverse off this level to drop lower.
Sell entry is at 1.4396 which is a pullback resistance that aligns with the 23.6% Fibonacci retracement level.
Stop loss is at 1.4512 which is a level that sits above a swing-high resistance.
Take profit is at 1.4260 which is a swing-low support.
High Risk Investment Warning
Trading Forex/CFDs on margin carries a high level of risk and may not be suitable for all investors. Leverage can work against you.
Stratos Markets Limited (www.fxcm.com):
CFDs are complex instruments and come with a high risk of losing money rapidly due to leverage. 63% of retail investor accounts lose money when trading CFDs with this provider. You should consider whether you understand how CFDs work and whether you can afford to take the high risk of losing your money.
Stratos Europe Ltd (www.fxcm.com):
CFDs are complex instruments and come with a high risk of losing money rapidly due to leverage. 63% of retail investor accounts lose money when trading CFDs with this provider. You should consider whether you understand how CFDs work and whether you can afford to take the high risk of losing your money.
Stratos Trading Pty. Limited (www.fxcm.com):
Trading FX/CFDs carries significant risks. FXCM AU (AFSL 309763), please read the Financial Services Guide, Product Disclosure Statement, Target Market Determination and Terms of Business at www.fxcm.com
Stratos Global LLC (www.fxcm.com):
Losses can exceed deposits.
Please be advised that the information presented on TradingView is provided to FXCM (‘Company’, ‘we’) by a third-party provider (‘TFA Global Pte Ltd’). Please be reminded that you are solely responsible for the trading decisions on your account. There is a very high degree of risk involved in trading. Any information and/or content is intended entirely for research, educational and informational purposes only and does not constitute investment or consultation advice or investment strategy. The information is not tailored to the investment needs of any specific person and therefore does not involve a consideration of any of the investment objectives, financial situation or needs of any viewer that may receive it. Kindly also note that past performance is not a reliable indicator of future results. Actual results may differ materially from those anticipated in forward-looking or past performance statements. We assume no liability as to the accuracy or completeness of any of the information and/or content provided herein and the Company cannot be held responsible for any omission, mistake nor for any loss or damage including without limitation to any loss of profit which may arise from reliance on any information supplied by TFA Global Pte Ltd.
The speaker(s) is neither an employee, agent nor representative of FXCM and is therefore acting independently. The opinions given are their own, constitute general market commentary, and do not constitute the opinion or advice of FXCM or any form of personal or investment advice. FXCM neither endorses nor guarantees offerings of third-party speakers, nor is FXCM responsible for the content, veracity or opinions of third-party speakers, presenters or participants.

USDCAD-BUY strategy 6 horuly chartThe pair had a rough ride upwards and followed by a similar aggressive down move. Now we have settled lower,and started recovery. the recovery may continue towards 1.4460 area is my personal view.
Strategy BUY @ 1.4320-1.4340 and take profit near 1.4445 for now.

USDCAD Range Trading: Key Support and Resistance LevelsUSDCAD Range Trading: Key Support and Resistance Levels
In the daily chart, USDCAD is developing a large range trading pattern, where the price has been oscillating within this range for the past 50 days.
The current support zone has been tested multiple times, leading to subsequent upward movements.
Despite recent price weakness, it is possible that the support zone may prompt a price reaction once again. Watch for potential reversal signs that indicate a change in the current trend.
Key Resistance Zones:
1.4345
1.4395
You may find more details in the chart!
Thank you and Good Luck!
❤️PS: Please support with a like or comment if you find this analysis useful for your trading day❤️
Disclosure: I am part of Trade Nation's Influencer program and receive a monthly fee for using their TradingView charts in my analysis. This helps me cover the cost of providing regular insights.

USD_CAD WILL GO UP|LONG|
✅USD_CAD fell again to retest the support of 1.4260
But it is a strong key level
So I think that there is a high chance
That we will see a bullish rebound and a move up
LONG🚀
✅Like and subscribe to never miss a new idea!✅

How will Canada react to Trump's tariff moves a month later ?When viewed from the monthly chart, I realised it takes approximately 4-5 years for the price action to reach the peak level, around 1.46.
There are many comments online saying that Canada should counteract with imposing tariffs on its energy to US and so on. Who's right , who's wrong ? I also dunno.
I am awaiting for a good opportunity to short this pair , how about you ?

USDCAD Trade in MotionWatching for price to hit 1.42857, aligning with our expectations before the Feb 6 deadline.
Market structure remains intact—keeping an eye on how this trade plays out.
📊 Replay all trades on TradingView for transparency.
#Forex #USDCAD #MarketAnalysis #TradingStrategy

Potential bullish bounce?The Loonie (USD/CAD) has bounced off the pivot which has been identified as pullback support and could rise to the 1st resistance.
Pivot: 1.4295
1st Support: 1.4176
1st Resistance: .4405
Risk Warning:
Trading Forex and CFDs carries a high level of risk to your capital and you should only trade with money you can afford to lose. Trading Forex and CFDs may not be suitable for all investors, so please ensure that you fully understand the risks involved and seek independent advice if necessary.
Disclaimer:
The above opinions given constitute general market commentary, and do not constitute the opinion or advice of IC Markets or any form of personal or investment advice.
Any opinions, news, research, analyses, prices, other information, or links to third-party sites contained on this website are provided on an "as-is" basis, are intended only to be informative, is not an advice nor a recommendation, nor research, or a record of our trading prices, or an offer of, or solicitation for a transaction in any financial instrument and thus should not be treated as such. The information provided does not involve any specific investment objectives, financial situation and needs of any specific person who may receive it. Please be aware, that past performance is not a reliable indicator of future performance and/or results. Past Performance or Forward-looking scenarios based upon the reasonable beliefs of the third-party provider are not a guarantee of future performance. Actual results may differ materially from those anticipated in forward-looking or past performance statements. IC Markets makes no representation or warranty and assumes no liability as to the accuracy or completeness of the information provided, nor any loss arising from any investment based on a recommendation, forecast or any information supplied by any third-party.

USD/CAD Next Move ?Does anyone think this is a blow-off top driven by the tariff news, or could it be a breakout retest leading to further gains?
I'd love to hear your thoughts. Personally, I’m leaning toward a blow-off top reversal, but nothing is certain—only time will tell. Let me know what you think!

USDCAD POSSIBLE BOUNCE OFF THE PULLBACK SUPPORT Price is heading towards a pullback support level of 1.41675 from that area , we may likely see a bounce in price to the upside. A buy opportunity is envisaged from that area. Fundamentally, a weaker USD will aid the possibility of price getting to that point

Price rejects at a 10 yrs old resistance zonePrice has rejected at a major resistance zone creating a triple top resistance
The market has also broken out of our ascending trendline signaling chances of a bear run occurring in the near future
Price can pullback to retest our broken trendline before falling further down

USDCAD - 5 Feb 2025 SetupUSDCAD market turn to slightly bearish on H1 timeframe and the all the ema's has broken to the downside. Spotted nearest supply area (Red Rectangle).we have a chance to take a short position from this area.
Entry Position : Short
Profit Target : 1:3 Shown on the chart image (Green Line)
Stop Loss : Slightly above supply area (Red Line)
Follow me if u guys making any gains from this idea.
Thanks
Coffee Trade Team

USDCAD SELL AT SUPPLY ZONE SMART MONEY CONCEPT Hello trader, here on Usdcad price has form a supply around level of 1.47425 and is likely to continue falling so trader should go for short with expect profit target of 1.45615 and 1.43635 . Use money management

USDCAD longDXY still coming into a bit of bid imo, could motivated UC to fill back up some of this innefficient area

usdcad long term tradeusdcad looking to sell if market demand zone dosnt hold and also looking to buy if market reverses

USDCAD long.DXY coming into a bit of liquidity. A small long response at previous monthly low. The move here needs to be fairly thin and not continue to accumulate. Just looking to trade the extension back


Breakout on USDCADUSDCAD Breakout Analysis
February 4, 2025
Technical Setup: Breakout Trade
Breakout confirmed after consolidation period
Previous resistance becoming support
Trade setup
Clear break above consolidation range
Strong momentum after breakout
Higher highs forming after breakout
Trade Opportunity
Entry: Support zone after break out
Stop Loss: Below breakout level
Targets: floating profit to catch major bullish trend

USDCAD Testing Key Demand Zone - Bullish Bounce ExpectedOANDA:USDCAD is trading at a significant demand zone, highlighted by prior strong price reactions. This area serves as a critical support level, where buyers have historically stepped in to push prices higher. The current market structure suggests a potential bullish reaction if momentum emerges.
I anticipate that if the price confirms a rejection from this demand zone, marked by bullish candlestick patterns or clear rejection wicks, the pair could move upward toward the 1.43960 level.
Let me know if you agree with this analysis or have additional insights! Feel free to share your thoughts in the comments.

USD/CAD may fall to 1.42608 - 1.42073Preference:
Short positions below 1.43895 with targets at 1.42608 and 1.42073 in extension.
As long as 1.43895 is resistance, look for choppy price action with a bearish bias.
Alternative:
If price stays above 1.43895, look for further upside with 1.44518 and 1.44873 as targets.
