USDCADTook the first wave of USDCAD and rode that successfully and we've have been given a re-entry for yet another long position. The pair is on some recovery as it makes it's way to the downside on the overall timeframe so entry has to be calculated carefully.
Trump's Tax tariffs, some friction with Canada, lingering war between Russia, the EU and Ukraine really having some effects on this pair
We would ride this pair all the way to the upside carefully so, brace up!
USDCAD_LMAX trade ideas

USDCAD INTRADAY bearish below 1.4060The USDCAD pair is exhibiting a bearish sentiment, reinforced by the ongoing downtrend. The key trading level to watch is at 1.4060, which represents the current intraday swing low and the falling resistance trendline level.
In the short term, an oversold rally from current levels, followed by a bearish rejection at the 1.4060 resistance, could lead to a downside move targeting support at 1.3825, with further potential declines to 1.3700 and 1.3540 over a longer timeframe.
On the other hand, a confirmed breakout above the 1.4060 resistance level and a daily close above that mark would invalidate the bearish outlook. This scenario could pave the way for a continuation of the rally, aiming to retest the 1.4160 resistance, with a potential extension to 1.4270 levels.
Conclusion:
Currently, the USDCAD sentiment remains bearish, with the 1.4060 level acting as a pivotal resistance. Traders should watch for either a bearish rejection at this level or a breakout and daily close above it to determine the next directional move. Caution is advised until the price action confirms a clear break or rejection.
This communication is for informational purposes only and should not be viewed as any form of recommendation as to a particular course of action or as investment advice. It is not intended as an offer or solicitation for the purchase or sale of any financial instrument or as an official confirmation of any transaction. Opinions, estimates and assumptions expressed herein are made as of the date of this communication and are subject to change without notice. This communication has been prepared based upon information, including market prices, data and other information, believed to be reliable; however, Trade Nation does not warrant its completeness or accuracy. All market prices and market data contained in or attached to this communication are indicative and subject to change without notice.

USDCAD Selling not over yet.Last time we looked at the USDCAD pair (March 21, see chart below), we got the most optimal sell entry that easily hit our 1.4000 Target:
As the price broke below its 1D MA200 (orange trend-line) having made a significant correction since the February 03 High, we believe there is more selling to be made at least on the short-term.
That is because the Higher Lows Zone that started on the May 2021 market bottom, hasn't yet been tested and since December 2023, the market always broke inside it before rebounding.
As a result, we expect a new rejection on the 1D MA200, delivering a 1.38200 Target.
-------------------------------------------------------------------------------
** Please LIKE 👍, FOLLOW ✅, SHARE 🙌 and COMMENT ✍ if you enjoy this idea! Also share your ideas and charts in the comments section below! This is best way to keep it relevant, support us, keep the content here free and allow the idea to reach as many people as possible. **
-------------------------------------------------------------------------------
Disclosure: I am part of Trade Nation's Influencer program and receive a monthly fee for using their TradingView charts in my analysis.
💸💸💸💸💸💸
👇 👇 👇 👇 👇 👇

USDCAD Technical and Order Flow AnalysisOur analysis is based on multi-timeframe top-down analysis & fundamental analysis.
Based on our view the price will rise to the monthly level.
DISCLAIMER: This analysis can change anytime without notice and is only for assisting traders in making independent investment decisions. Please note that this is a prediction, and I have no reason to act on it, and neither should you.
Please support our analysis with a like or comment!

USDCAD DUE FOR RELIEF THIS WEEKUSDCAD is approaching major weekly support after the multiple weeks of a sell of off; in line with a .618 fibronacci retracement. Although as price rest on this level of demand, it will need a few days to mature.
-On the daily time frame we see an overextension to the downside as the RSI nears 30 with levels in line with weekly as well.
-Personally I'll be waiting for price to mature on the 4hr timeframe to take entry on some buys.
-

USDCAD 4HR ChartThis is the 4 hr chart of usdcad, I am publishing this chart for further informational analysis. Ideally, further analysis will use smart money concepts, ICT, and wick candle analysis.

USDCAD us in Reversal USDCAD is showing the Reversal signs on daily chart it is testing the 0.618 fib level and the 1hr TFM is showing the divergence so it can go on the long side for some time

USDCAD LONG BEFORE SHORTPrice take a down movement until the demand zone on 1.38625 maybe it will be a great trade today.
Stay with my analysis yesterday and keep on beliver in analysis than forecasting.
Zone buy: 1.38625 - 1.38499
SL: 1.38390
TP: 1.39688

USDCADPotential Buys,
Broke from a short term downtrend within a long term overall trend. Using previous down trend resistance as a new support backing up as a confluence for this trade

USD/CAD For Bullish as pull-backyou can go long now
general trend is down trend
current phase is pull-back
have fun :)

USDCAD | 14.04.2025BUY 1.38600 | STOP 1.37700 | TAKE 1.39800 | Technical view: divergence. A probable upward correction from the strong medium-term support level will bring the price back to the 1.40000 area.

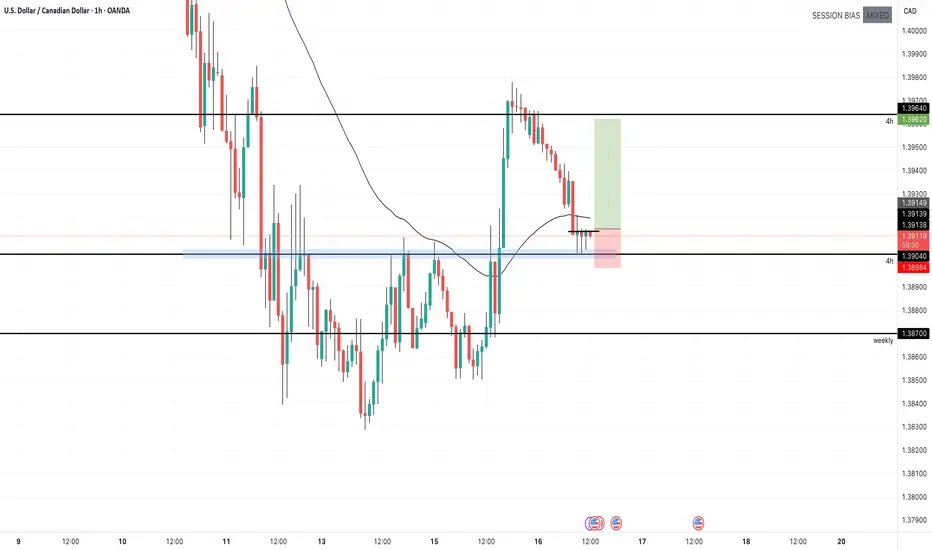
USD/CAD – Bullish Reversal Zonea at Trendline + Morning StarUSD/CAD is currently forming a bullish reversal setup, which often signals a potential upside move.
Right now, the price is testing a key support and a historical demand zone, while also printing a Morning Star candlestick pattern on the daily timeframe, which is a classic bullish reversal signal. ⚠️
If buyers hold the trendline and we see a breakout above the recent minor high around 1.3950, we could see a bullish move toward the 1.4050–1.4170 zone. 🎯
🔹 Trade Setups to Consider:
1️⃣ Aggressive Long (Based on Morning Star Pattern) 📍 Entry: 1.3915
🛑 Stop Loss: 1.38143
🎯 Targets: 1.40248 ➡️ 1.41290
💬 What’s your view on USD/CAD? Drop your thoughts below 👇
#Forex #TradingSetup #PriceAction #TechnicalAnalysis #TradeIdeas #FX #USDCAD #Reversal #MorningStar #CandlestickPatterns #TrendlineSupport

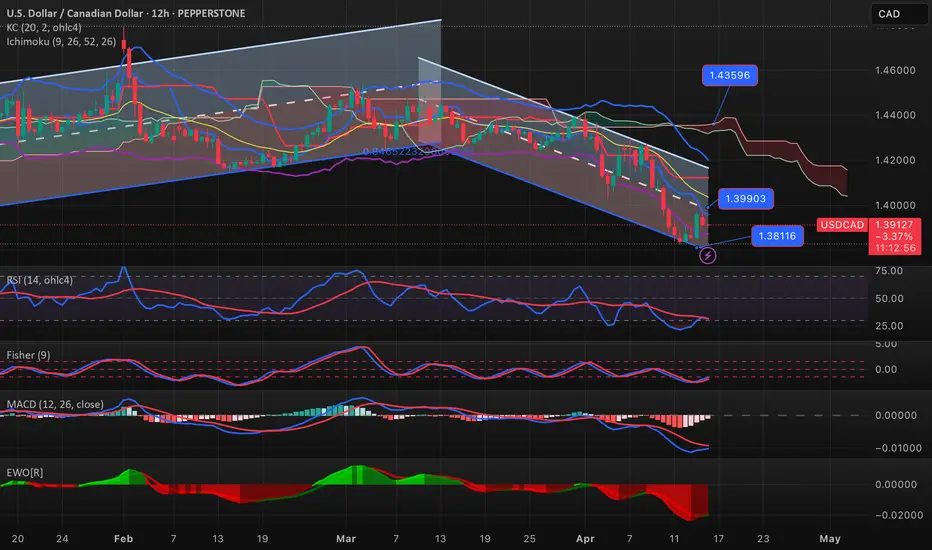
USDCAD-BUY strategy 12 hourly chart - Regression channelsThe pair seems to be in a corrective mode currently. The 90-min chart still has some underlying weakness, but overall we are improving. I feel we may have a chance to test 1.3990 and en-route 1.4078 recovery level.
Strategy BUY @ 1.3875-1.3900 and take profit near 1.4067 for now.
LONG IDEA ON USDCADI am looking to buy USDCAD from the london zone highlighted on my chart, if i dont find a reversal pattern, i will wait for price to drop to the NY zone i mapped out and look for reversals/by opportunity from there.... My major reversal patterns are doube bottom, divergence, or any other reversal candle stick. Good luck

USDCAD Long IdeaWill wait for this long area if we get it if we just miss it will look to enter of a 15min BOS. this is not financial advice. happy trading
33

USDCAD H4 | Bullish Rise Based on the H4 chart analysis, the price is approaching our buy entry level at 1.3908, a pullback support.
Our take profit is set at 1.4055, a pullback resistance that aligns with the 50% Fibo retracement.
The stop loss is placed at 1.3828, a swing low support level.
High Risk Investment Warning
Trading Forex/CFDs on margin carries a high level of risk and may not be suitable for all investors. Leverage can work against you.
Stratos Markets Limited (tradu.com):
CFDs are complex instruments and come with a high risk of losing money rapidly due to leverage. 63% of retail investor accounts lose money when trading CFDs with this provider. You should consider whether you understand how CFDs work and whether you can afford to take the high risk of losing your money.
Stratos Europe Ltd (tradu.com):
CFDs are complex instruments and come with a high risk of losing money rapidly due to leverage. 63% of retail investor accounts lose money when trading CFDs with this provider. You should consider whether you understand how CFDs work and whether you can afford to take the high risk of losing your money.
Stratos Global LLC (tradu.com):
Losses can exceed deposits.
Please be advised that the information presented on TradingView is provided to Tradu (‘Company’, ‘we’) by a third-party provider (‘TFA Global Pte Ltd’). Please be reminded that you are solely responsible for the trading decisions on your account. There is a very high degree of risk involved in trading. Any information and/or content is intended entirely for research, educational and informational purposes only and does not constitute investment or consultation advice or investment strategy. The information is not tailored to the investment needs of any specific person and therefore does not involve a consideration of any of the investment objectives, financial situation or needs of any viewer that may receive it. Kindly also note that past performance is not a reliable indicator of future results. Actual results may differ materially from those anticipated in forward-looking or past performance statements. We assume no liability as to the accuracy or completeness of any of the information and/or content provided herein and the Company cannot be held responsible for any omission, mistake nor for any loss or damage including without limitation to any loss of profit which may arise from reliance on any information supplied by TFA Global Pte Ltd.
The speaker(s) is neither an employee, agent nor representative of Tradu and is therefore acting independently. The opinions given are their own, constitute general market commentary, and do not constitute the opinion or advice of Tradu or any form of personal or investment advice. Tradu neither endorses nor guarantees offerings of third-party speakers, nor is Tradu responsible for the content, veracity or opinions of third-party speakers, presenters or participants.

USDCAD LONG UPDATEAs I told in the last trade idea USDCAD is BULLISH and if price keeps holding we might see Take Profit hit.


USDCADI believe price will retrace to this zone and then push to a higher major resistance.
Why? Price broke past a key area highlighted above, indicating we ae in a shifted bull trend and I am to trade until the marked zone

USDCADLovely trade taken. I posted this on here as a nice entry point. 3% profit back.
Congrats to anyone who took it

USD/CAD For Bullish as Pull-Backyou can go long now
general trend is down trend
current phase is pull-back
have fun :)

After CAN CPIs, it's time to prepare for BoC rate decisionLooking at the CPI numbers that came out, we are noticing some weakness in the CAD right now. This weakness may spill over into tomorrow's trading, as the BoC is expected to keep the rates unchaged.
Let's dig in!
FX_IDC:USDCAD
MARKETSCOM:USDCAD
Let us know what you think in the comments below.
Thank you.
77.3% of retail investor accounts lose money when trading CFDs with this provider. You should consider whether you understand how CFDs work and whether you can afford to take the high risk of losing your money. Past performance is not necessarily indicative of future results. The value of investments may fall as well as rise and the investor may not get back the amount initially invested. This content is not intended for nor applicable to residents of the UK. Cryptocurrency CFDs and spread bets are restricted in the UK for all retail clients.
