USDCAD A break of the 4hr structure would call for the following, A break of the daily that would lead us breaking the 4hr BOT. Unless Trump does the unthinkable, this will be a good swing trade to hold.
Based on the weekly, it would indicate the end of the W. counter trend and a continuation of the bullish move
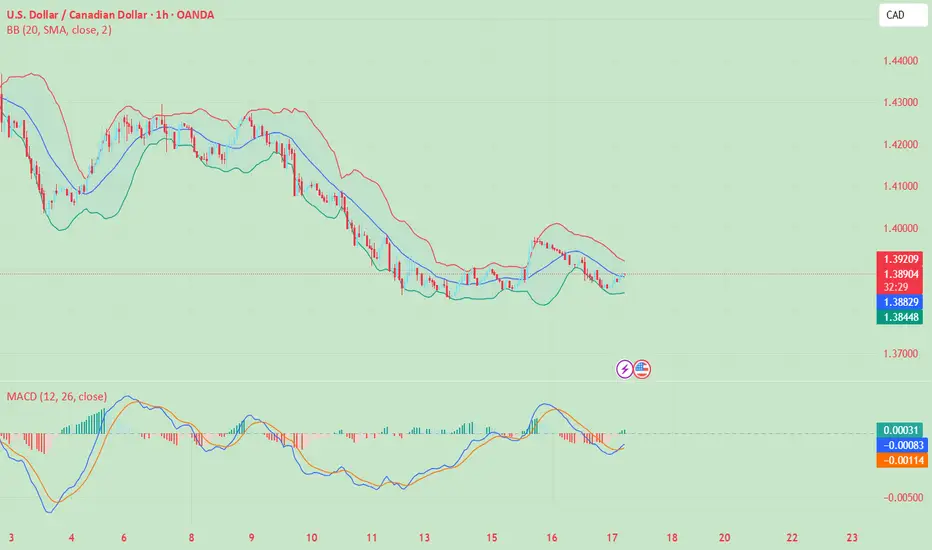
USDCAD_LMAX trade ideas

USD/CAD Analysis (30min TimeframeUSD/CAD
Timeframe: 30-Minute Chart
Trend: Bearish (within a descending channel)
---
Entry Point:
Entry Price: 1.38192 (current market price marked on chart)
---
Take Profit Targets:
TP1: 1.37812 (labeled "TARGET 1")
Final TP (TP2): 1.37374 (labeled "TARGET 2")
---
Support Levels:
1.37812 – First major support level (TP1)
1.37374 – Second strong support level (TP2, previous structure low)
---
Resistance Levels:
1.38192 – Current entry zone and minor resistance (short-term reaction level)
1.38400 - 1.38500 – Mid-channel resistance area
1.38700+ – Upper trendline resistance (from channel)
---
Chart Structure:
Descending Channel: Price is respecting a downward sloping parallel channel.
Bearish Momentum: Lower highs and lower lows.
Entry at Pullback: Entry aligns with a pullback to channel mid-zone.
---
Suggested Caption to Share with Your Client:
> USD/CAD Trade Setup (30-Min Chart):
Price is trending inside a descending channel.
Entry: 1.38192
TP1: 1.37812
Final TP: 1.37374
Trend: Bearish
Expecting continuation to downside after pullback.
Key Resistance: 1.38400–1.38700
Key Support: 1.37812, 1.37374
Watch for bearish confirmation at entry level before executing.

usdcad short/sellSignificant key levels reactions #trends #analysis #forex use proper risk management

USDCAD Ready to Collapse? COT Signals a Bearish Storm!🔎 1. COT Context – Canadian Dollar (CAD)
Asset Managers: Consistently net short for most of the period, but since January 2025, there's been a strong recovery—net positions have become progressively less negative. By mid-April, they’re still short, but significantly less so.
Leveraged Money: Also heavily short in December 2024, but showing a clear bullish reversal starting in early 2025, with net positions turning increasingly positive on CAD.
✅ Interpretation: There's been a clear sentiment shift from bearish to bullish on CAD starting late 2024. This adds downward pressure on USDCAD.
💵 2. COT Context – US Dollar Index (USD)
Asset Managers: Consistently long, but reducing their net exposure since late March 2025.
Leveraged Money: Opposite of CAD – heavily short in December 2024, now recovering, though without strong momentum. Positions are hovering around neutral.
⚠️ Interpretation: While CAD grows stronger, USD shows signs of indecision or profit-taking. This amplifies the bearish bias on USDCAD.
📉 3. Technical Analysis – USDCAD
Current Price: 1.38369, right near a strong demand zone between 1.3700 – 1.3830, which has already been tested multiple times.
The current weekly candle is forming a doji or pin bar, hinting at a potential technical bounce.
Key Resistance: 1.45215 (monthly high).
Key Support: 1.3700. A breakdown below this could trigger a move toward 1.3480.
RSI: Neutral to slightly bearish, no major divergences observed.
🧠 Technical Outlook:
If the 1.3700–1.3830 zone holds, we might see a corrective bounce toward 1.4000–1.4100.
If that zone breaks, expect a bearish continuation toward 1.3580–1.3480.
📊 Trade Summary
Fundamental Bias (COT): Bearish USDCAD → Strong CAD, weakening USD.
Technical Bias: Neutral to bearish, potential for short-term bounce before continuation.
🧭 Trade Plan
🎯 Short on pullback toward 1.4000–1.4100 with stop above 1.4150, targeting 1.3600–1.3500.
🎯 Breakout trade below 1.3700 → Enter on daily close confirmation, target 1.3480.

USD/CAD SELL/SHORTBy utilizing levels, historical patterns, , we can formulate a hypothesis that the market might follow a similar trajectory if bearish sentiment prevails.

Good strong short on this pair "USDCAD"From my point of view I see market clearly indicating aa strong will for a sell of CAD due to some unseen circumstances its just an ideas that may like come into light if my POI is validated at my price, placing a short for this week. hoping to buy more CAD over US dollars.

USDCAD Bearish trend / short-sellUSDCAD stopped making new higher highs and higher lows.It started displaying indications of trend reversal.

USD/CAD – Bullish Reversal Brewing from Key Support (Daily ChartAfter an extended leg lower, USD/CAD is now posting signs of basing near major support at the 1.3815–1.3800 zone. The sellers appear to be exhausting, and bulls may be preparing for a counter-trend rally or even a shift in structure if momentum aligns.
🔍 Technical Setup:
Key Support Holding: Price is respecting the 1.3815–1.3800 area, a level that previously acted as resistance and is now serving as strong support.
Stochastic Momentum: Stochs are deeply oversold and beginning to curl upward, signaling early bullish momentum and potential for a reversal move.
Candlestick Behavior: Multiple small-bodied candles with long lower wicks at this level suggest buyer absorption and fading bearish strength.
EMA Watch: The 8 & 36 EMAs are still bearish, but price consolidating below them could set up a mean reversion play targeting the 1.4180 zone, where EMAs and prior structure converge.
⏫ Bullish Bias Drivers:
Daily Bullish Divergence Watch: Price is printing lower lows, but momentum is failing to confirm — potential for bullish divergence to support a bounce.
Clear Rejection of Bear Continuation: Despite bearish trend structure, there’s no daily close below 1.3800 — which could mean a bull trap failed to trigger.
Measured Move Potential: If this bounce gains traction, a swing move into the 1.4180 resistance zone (former structure and EMA confluence) is on the table.
🌐 Macro Fundamentals Backing a Bounce:
DXY Softness: The U.S. Dollar Index is weakening amid softer economic data and renewed trade concerns. If this cools off, we could see short-term strength as USD rebalances.
Canadian Dollar Sensitivity: Oil prices are high, but extended gains could stall — offering USD/CAD a window to lift off this oversold zone.
Positioning and Sentiment: Bearish sentiment on USD/CAD is becoming crowded — potential for a short squeeze if momentum flips.

GOLDMASTER1 | USDCAD 15M SHORTSure! Here's a caption you can use for your post based on the USDCAD 15M chart:
---
USDCAD 15M BREAKDOWN BY GOLDMASTERS1
Spotted a clean setup with confluences aligning:
Double Bearish Order Blocks acting as supply
BOS + CHoCHs confirming bearish intent
Entry just below the lower order block
Targeting the 1.37983 Demand Zone with solid RR
PATIENCE IS KEY—WAITING FOR PRICE TO REACT FROM THESE ZONES FOR CONFIRMATION.
SMART MONEY CONCEPT IN ACTION
GOLDMASTER1---

USDCAD: Growth & Bullish Continuation
Looking at the chart of USDCAD right now we are seeing some interesting price action on the lower timeframes. Thus a local move up seems to be quite likely.
Disclosure: I am part of Trade Nation's Influencer program and receive a monthly fee for using their TradingView charts in my analysis.
❤️ Please, support our work with like & comment! ❤️

A break down from the current zone, aim the unmitigated!Expecting price to play around the current zone or a possible reversal to the upside is expected to grab liquidity, a shift to the down side afterwards, targeting the unmitigated low where the bulls are waiting.

Daily Price Action: USDCAD Thursday 4/17/2025In this video, we will be looking into the potential price action of USDCAD.

USDCAD 1D ChartThis is the 1 D chart of usdcad, I am publishing this chart for further informational analysis. Ideally, further analysis will use smart money concepts, ICT, and wick candle analysis.

Who's with me on USDCAD sells?A downtrend continuation.
USDCAD is bearish, we can see the trend from the higher timeframe down to the 15 minutes.
It broke a structure, created an imbalance. We're currently waiting for price to take out liquidity and trigger our orders

USD/JPY(20250417)Today's AnalysisMarket news:
U.S. import prices fell 0.1% in March from the previous month, the first month-on-month decline since September last year.
Technical analysis:
Today's buying and selling boundaries:
143.10
Support and resistance levels:
144.08
143.72
143.48
142.72
142.48
142.11
Trading strategy:
If the price breaks through 143.10, consider buying, the first target price is 143.48
If the price breaks through 142.72, consider selling, the first target price is 142.48
USD/CAD(20250417)Today's AnalysisMarket news:
U.S. import prices fell 0.1% in March from the previous month, the first month-on-month decline since September last year.
Technical analysis:
Today's buying and selling boundaries:
1.3923
Support and resistance levels:
1.4050
1.4002
1.3972
1.3875
1.3844
1.3797
Trading strategy:
If the price breaks through 1.3972, consider buying, with the first target price at 1.4002
If the price breaks through 1.3923, consider selling, with the first target price at 1.3875

USDCAD 1 Hr ChartAttached is the 15 minute chart for USDCAD, posting for further utilization. I'm interested in smart money concepts and ict

USDCAD 15 M ChartAttached is the 15 minute chart for USDCAD, posting for further utilization. I'm interested in smart money concepts and ict

USDCAD Bear Flag pattern still in play, POST BOCIntraday Update: The USDCAD slipped to bear flag support following the interest rate decision. The market was trading short CAD in hopes of a cut, and was disappointed. A break of the 1.3830 level would open up channel support at 1.3760. The BOC presser is ongoing at time of writing.

USDCAD Long IdeaUSDCAD form a breakdown from a tringle with MMC (Mirror Market structure ) it will repeat it self and and gonna go up again in the triangle.
#USDCAD

BOC decision - trading the uncertaintyMarkets are narrowly leaning toward no rate cut from the Bank of Canada this Wednesday. Markets were pricing a 58% chance of a pause as of Friday last week. With traders nearly evenly split, short-term volatility in USD/CAD is possible.
While the Bank had previously signaled it would "proceed carefully" on future rate cuts, that guidance came before the heightened risks tied to the U.S. “Liberation Day” tariff announcements.
From a technical standpoint, there are early signs the pair may be forming a near-term bottom. If the BOC holds rates steady, USD/CAD could retake its 200-day moving average, opening the door for a move toward resistance near 1.4100.

Daily Price Action: USDCAD Tuesday 4/15/2025In this video, we are looking into the potential daily price action of USDCAD.

USD/CAD 1H Breaking Structure: The Start of a New Trend?Hi traders! Analyzing USD/CAD on the 1H timeframe, spotting a potential bullish reversal from a descending wedge pattern:
🔹 Entry: 1.38846
🔹 TP: 1.40286
🔹 SL: 1.37692
Price is bouncing off the lower boundary of a falling wedge, showing signs of bullish divergence with RSI also turning upwards. The breakout of the descending structure may signal a trend reversal or at least a corrective move to the upside.
The RSI is recovering from the oversold region, reinforcing the idea of a possible bullish push. A break and close above the minor resistance zone could confirm the move towards higher levels.
Watching closely for momentum confirmation!
⚠️ DISCLAIMER: This is not financial advice. Every trader must evaluate their own risk and strategy.
