USDCAD_LMAX trade ideas

"USD/CAD Short Setup – Supply Zone Rejection & Bearish Target 🔵 Supply Zone
📍 Marked between 1.39039 and 1.39624
🔥 Strong selling pressure area
🧱 Price previously dropped from here — possible resistance again.
🎯 Trade Setup
🟢 Entry Point
⚡ 1.39039 (just below supply zone)
Waiting for price to tap the zone and show bearish confirmation
❌ Stop Loss
🚫 1.39624 (above supply zone)
Break above invalidates the setup
🏁 Target Point
🎯 1.36510
Based on previous support area
Potential profit of ~245 pips
📊 Risk-to-Reward Ratio
📉 Risk: ~58 pips
💰 Reward: ~245 pips
🧮 R:R = 1:4.3 — excellent!
📈 Trend Confirmation
📉 Price below EMA (7) — short-term bearish
🧠 Momentum supports sell setup
🗓️ Economic Events Incoming
📢 News icons suggest upcoming events that may cause volatility
⚠️ Be cautious with timing — news may shake the market!

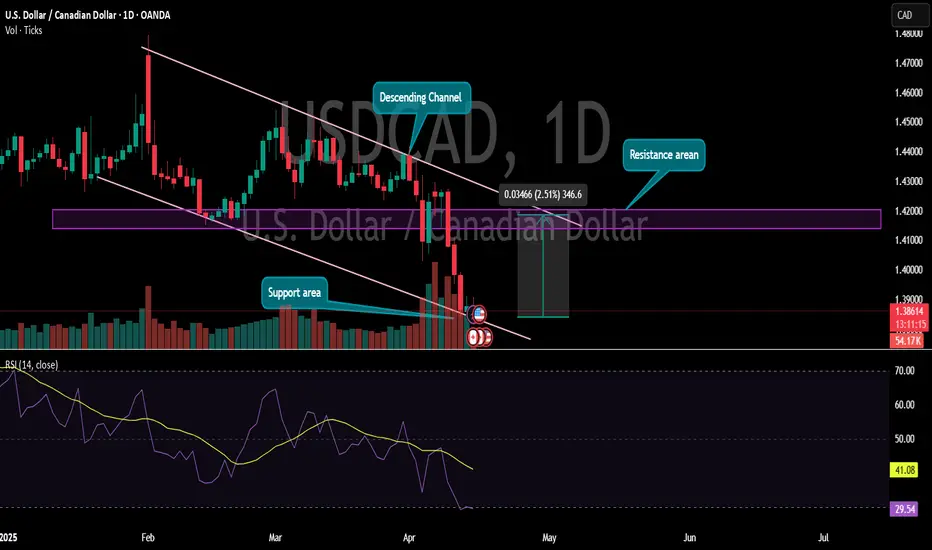
USDCAD 1 day time frame 📉 Overall Structure: Descending Channel
The price is moving within a clearly defined descending channel, indicating a downtrend.
Price is respecting both upper and lower boundaries of the channel, confirming strong bearish momentum.
📍 Key Levels:
🔻 Support Area (~1.3740–1.3800)
Price is currently hovering near the bottom boundary of the channel and just above a marked support zone.
Historically, this zone has triggered bullish reactions, making it a key level to watch for a potential bounce or reversal.
🔺 Resistance Area (~1.4150–1.4200)
Marked in purple, this zone aligns with previous swing highs and structure, making it a significant resistance level.
If price bounces from the current support, this is the first target area to watch.
📊 Volume
Notice the increased red volume bars as the price moved lower – this confirms strong selling pressure.
However, the recent candle shows a smaller body with lower volume, hinting at a potential exhaustion of sellers.
📉 RSI (Relative Strength Index) – Oversold
RSI is at 29.47, which is below the 30 level – indicating the pair is oversold.
When RSI dips this low, it often precedes a bounce or temporary bullish correction, especially if price is at a key support (which it is).
✅ Trade Idea / Potential Setup
Bullish Reversal Setup Possible:
The confluence of:
Oversold RSI,
Major support,
Bottom of the descending channel,
makes this a potential area for a long (buy) position.
Target: Resistance area around 1.4150–1.4200 (2.5% gain).
Stop-loss: Below the channel/support zone to limit risk.
🧠 Summary:
USDCAD is in a downtrend but currently testing a major support area at the channel bottom.
RSI is oversold, suggesting limited downside.
Look for bullish confirmation (e.g., bullish engulfing candle or a break of short-term structure) before entering long.
USDCAD LONGOpening a long position on USD/CAD based on a bullish outlook for the U.S. dollar and potential Canadian dollar weakness. The pair has found strong support near and is showing bullish momentum with a break above , supported by rising moving averages and positive RSI/MACD crossover.
Entry:
Stop Loss:
Take Profit:
Risk/Reward Ratio:
Timeframe:
Rationale: Strength in USD due to hawkish Fed stance, weaker oil prices pressuring CAD, and possible divergence in economic performance between U.S. and Canada.

USDCAD💡Chart analysis of the USD/CAD currency pair (daily time frame). The price broke the support structure and shifted to a downtrend. Wait for a retest of the red zone and enter a short position from it if bearish price action (such as a reversal candle) appears. MACD indicator: There are no signs of weakening negative momentum so far, which reinforces the downside scenario.
⛔️Not investment advice for educational purposes only.

USDCAD Price on USDCAD is at a important decision point. All timeframes are bearish but we are sitting at weekly resistance that has held since 2022. Just by looking at the trend I would want price to go below that zone and shift structure so we can look for a entry to sell. But in my opinion I think this week it will do some retracing back to one of those higher zones. As the week goes on we will see how price plays out.

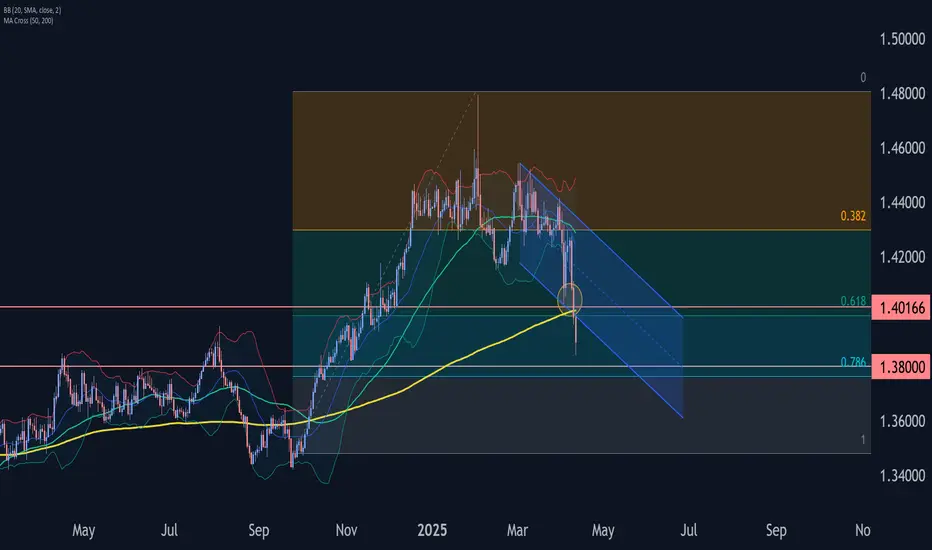
USDCAD - BUY/LONG opportunity?On this trade I am going to remain neutral until price breaks above the yellow line. However, simply because of where price is located now it's a very good risk to reward ratio and it could be entered into now.
completed 161.8 extension
61.8 fib retracement of the bullish macro trend
currently breaking bearish trendline acting as resistance

USDCAD Breakout Setup Brewing — Watch These Key Zones Closely!USDCAD is sitting on a major demand zone around 1.38579 — clearly marked by the orange box. We’ve seen strong rejections here in the past, and price is now consolidating at the very edge of this zone.
Above us, there’s a key resistance level at 1.40664, aligning with the supply zone (blue box). This creates a beautiful range-trading opportunity or even a potential breakout play.
---
What to Watch:
1. Bullish Scenario (Green Arrows):
If price holds this demand zone, we may see a bounce to 1.40664 or even a clean breakout toward 1.42000.
Watch for a strong bullish engulfing candle or liquidity sweep at the bottom of the zone.
Confirmation could be an impulsive move up with volume.
2. Bearish Break (Low Probability for Now):
If price breaks and closes below 1.38500, expect a deeper drop — but volume and structure will confirm this.
Look for a retest of the zone from below before shorting.
---
Why This Setup Matters:
Order blocks and supply/demand zones show where smart money trades.
Combining price action + structure + zones gives you a high-probability edge.
No need for indicators — just read the chart and wait for confirmation.
---
My Plan:
I’m watching this zone closely for a bullish reaction. If I get a clean entry signal, I’ll target 1.40664 and trail my stop.
Risk management is key — no FOMO.
---
What Do You Think?
Will USDCAD bounce or break?
Drop your thoughts in the comments and let’s learn together!
---
Follow for More:
If you like clean price action setups like this, follow me for more daily updates and trading ideas.

Bearish Outlook for USD/CAD Ahead of BoC Decision
- **Key Insights:** USD/CAD is currently exhibiting strong bearish sentiment,
driven by economic uncertainty and risk-off momentum affecting commodity-
linked currencies like CAD. Anticipation of a 25 basis point rate cut by the
Bank of Canada on Wednesday adds pressure on the CAD, compounded by higher
inflation expectations and slowing global growth. Short-term price movements
will likely depend on upcoming economic data and central bank decisions.
Traders should remain cautious of heightened volatility heading into
critical events this week.
- **Price Targets:**
Short Position:
- Target 1 (T1): 1.3720
- Target 2 (T2): 1.3600
- Stop Level 1 (S1): 1.3920
- Stop Level 2 (S2): 1.3950
- **Recent Performance:** USD/CAD has been moving within a bearish trajectory,
influenced by weak global commodity demand and risk-off sentiment. The pair
recently tested support at 1.3830 but rejected an advance toward 1.40
resistance as market conditions and investor sentiment remained unfavorable
for CAD. These developments hint at an increased likelihood of further
declines in the near term.
- **Expert Analysis:** Market cycles and psychological patterns suggest
persistent bearish trends in commodity-linked currencies, with CAD
potentially facing a secular bear market into 2026. The Bank of Canada is
likely to signal dovish intentions this week amid consumer caution and
rising layoffs, reinforcing bearish conditions for USD/CAD. Despite long-
term optimism tied to AI-driven innovation, structural risks continue to
weigh heavily on CAD’s performance.
- **News Impact:** The Bank of Canada’s rate decision on Wednesday is expected
to be a pivotal event, likely triggering downside momentum for the Canadian
Dollar should a rate cut materialize. Canadian CPI data earlier in the week
will help traders gauge inflation trends and economic strength.
Additionally, global factors, including economic concerns in China and
tariff-related risks, add to short-term pressure. CAD may also experience
mild volatility surrounding Canadian election developments, particularly if
the winning government emphasizes stronger commodity exports.

Daily UCAD Updates April 13 2025Hello Traders!
Hopefully this video can get uploaded to youtube. More importantly keep it simple and stick to the plan.

USDCAD Trendline Breakout Ready for a Long SellHello Traders
In This Chart EURUSD HOURLY Forex Forecast By FOREX PLANET
today EURUSD analysis 👆
🟢This Chart includes_ (EURUSD market update)
🟢What is The Next Opportunity on EURUSD Market
🟢how to Enter to the Valid Entry With Assurance Profit
This CHART is For Trader's that Want to Improve Their Technical Analysis Skills and Their Trading By Understanding How To Analyze The Market Using Multiple Timeframes and Understanding The Bigger Picture on the Charts

USDCAD is Likely to Test the Channel Support of 1.37 ?Last Friday, USDCAD broke through the support of the downward trend channel, which has now turned into resistance. It is currently situated in a strong support zone and may experience a pullback, encountering resistance. It is likely to return to the robust channel support at 1.37. Let's observe what happens.


super buy OPP.Hello traders. As I tellold you before price Hit the first TP. Let's go buy for second TP. (wink)

Short term buy/Long term sellLook8ng at the daily chart, price earlier created break of structure and pushed up to fill liquidity, which triggered sell afterwards based on the BOS.
Looking at the USD DXY formation, it's time to buy short term as price hit demand zone on daily.
Current demand zone would not hold much after a medium term because of equal low liquidity printed previously by the demand zone.
Sometime in the week, price will trigger new bearish move which is bound to create a long term sell again breaking below previous demand zone to a new low.


WHY USDCAD IS DROPPING ?? DETAILED ANALYSISUSDCAD is currently reacting from a strong daily supply zone after a sustained upside move, and we are now seeing clear signs of bearish structure forming. Price has broken through multiple short-term supports and is now trading around the 1.38600 level, sitting right above a key demand zone that held in late 2023. Given the aggressive sell-off and rejection from the 1.43400–1.44500 resistance range, the market appears to be preparing for a deeper retracement. My bearish target is 1.34600, which aligns with the previous major demand level and psychological support.
Technically, the chart shows two strong bearish engulfing moves from supply, followed by lower highs and lower lows. This shift in structure combined with repeated rejections from resistance zones indicates the momentum is shifting in favor of sellers. If the current zone fails to hold on the retest bounce, we could see a strong continuation leg down. I expect a minor correction toward 1.41600 before further downside resumes, offering an ideal risk-reward short setup for swing traders.
From a fundamental perspective, the Canadian Dollar remains firm, supported by strong crude oil prices as WTI holds above $85 amid geopolitical tensions and production cuts. At the same time, recent U.S. data has shown mixed signals, with sticky inflation keeping the Fed cautious, but slowing job growth and consumer spending raising concerns. If oil prices remain elevated and Fed rate cut expectations increase later this quarter, the USDCAD pair is likely to stay under pressure.
With CAD strength driven by energy markets and the USD facing headwinds from softening macro indicators, this setup aligns both technically and fundamentally for a bearish continuation. I’ll be watching for clean rejections from the 1.40000–1.41600 resistance zone before loading more shorts toward 1.34600. Patience is key — this could be a high-probability move in the coming weeks.

USD/CAD long positionEntry: Long at 1.3850
Stop Loss: 1.3775
Risk: 5 positions, each with 0.1% risk (total 0.5%)
Outlook: Medium-term (days to weeks)
Notes: Acknowledges potential downside to 1.36 if 1.38 breaks. Will consider re-entry at 1.36 if stopped out.

USDCAD Wave Analysis – 11 April 2025- USDCAD broke support zone
- Likely to fall to support level 1.3800
USDCAD currency pair recently broke the support zone between the support level 1.4040 (which reversed the price sharply at the start of April, as can be seen below), 50% Fibonacci correction of the upward price move from September and the support trendline of the daily down channel from March.
The breakout of this support zone accelerated the active short-term impulse wave 3 – which belongs to intermediate impulse wave (C) from February.
USDCAD currency pair can be expected to fall to the next support level 1.3800, former monthly low from November.
USD/CAD For Bullish as Pull-Backyou can go long now
general trend is down trend
current phase is pull-back
have fun :)

Pivot points and a bat pattern This is a bias view, bat patterns turned in one direction or another can be considered bullish or bearish. The pitchfork is of a three year multi wave system. It apparently has another wave up from the low as it’s established.

#USDCAD: We took the Swing Sell, Now let's focus on Swing Buy! The USD/CAD exchange rate experienced a significant decline, reaching its all-time high against the USD. This decline is primarily attributed to the ongoing trade dispute between China and the United States, which has led to a depreciation of the USD and resulted in a yearly low.
However, we anticipate a potential reversal in the price trajectory. We identify a favourable area where the price may stabilise and address the liquidity gap it has created.
We have established three targets, and to effectively utilise these targets, we recommend executing small entries with each target set based on a predetermined take-profit level.
We extend our sincere gratitude for your unwavering support throughout this journey within this community. Additionally, we appreciate the contributions of each individual who has supported our endeavours. We are pleased to announce that we have garnered 20,000 followers.
Much Love,
Team Setupsfx_
❤️🚀

#USDCAD:Swing Sell Possibly Worth 980+ Pips? Dear Traders,
We are approaching a strong bearish hold where we estimate price to reverse from depending on how market treat DXY in coming weeks. Please use accurate risk management.
