USDCHF.1.MINI trade ideas
USDCHF H4 | Bullish Continuation in Play?Based on the H4 chart analysis, the price is approaching our buy entry level at 0.9125, which is a key pullback support near the breakout zone. This level represents a potential continuation point within the prevailing uptrend.
Our take profit is set at 0.9214, near the 161.8% Fibonacci extension and a key resistance level.
The stop loss is placed at 0.9058, apullback support, providing room for price fluctuations while ensuring protection against invalidation of the bullish setup.
High Risk Investment Warning
Trading Forex/CFDs on margin carries a high level of risk and may not be suitable for all investors. Leverage can work against you.
Stratos Markets Limited (www.fxcm.com):
CFDs are complex instruments and come with a high risk of losing money rapidly due to leverage. 64% of retail investor accounts lose money when trading CFDs with this provider. You should consider whether you understand how CFDs work and whether you can afford to take the high risk of losing your money.
Stratos Europe Ltd, previously FXCM EU Ltd (www.fxcm.com):
CFDs are complex instruments and come with a high risk of losing money rapidly due to leverage. 66% of retail investor accounts lose money when trading CFDs with this provider. You should consider whether you understand how CFDs work and whether you can afford to take the high risk of losing your money.
Stratos Trading Pty. Limited (www.fxcm.com):
Trading FX/CFDs carries significant risks. FXCM AU (AFSL 309763), please read the Financial Services Guide, Product Disclosure Statement, Target Market Determination and Terms of Business at www.fxcm.com
Stratos Global LLC (www.fxcm.com):
Losses can exceed deposits.
Please be advised that the information presented on TradingView is provided to FXCM (‘Company’, ‘we’) by a third-party provider (‘TFA Global Pte Ltd’). Please be reminded that you are solely responsible for the trading decisions on your account. There is a very high degree of risk involved in trading. Any information and/or content is intended entirely for research, educational and informational purposes only and does not constitute investment or consultation advice or investment strategy. The information is not tailored to the investment needs of any specific person and therefore does not involve a consideration of any of the investment objectives, financial situation or needs of any viewer that may receive it. Kindly also note that past performance is not a reliable indicator of future results. Actual results may differ materially from those anticipated in forward-looking or past performance statements. We assume no liability as to the accuracy or completeness of any of the information and/or content provided herein and the Company cannot be held responsible for any omission, mistake nor for any loss or damage including without limitation to any loss of profit which may arise from reliance on any information supplied by TFA Global Pte Ltd.
The speaker(s) is neither an employee, agent nor representative of FXCM and is therefore acting independently. The opinions given are their own, constitute general market commentary, and do not constitute the opinion or advice of FXCM or any form of personal or investment advice. FXCM neither endorses nor guarantees offerings of third party speakers, nor is FXCM responsible for the content, veracity or opinions of third-party speakers, presenters or participants.

USDCHF: Potential Rejection from Resistance ZoneUSDCHF is currently trading near a significant resistance zone, as highlighted in the chart. This area coincides with a prior supply zone that has historically acted as a reversal point. The structure suggests that sellers may step in, pushing the price lower. If the pair confirms rejection from the resistance, we could see price drop towards 0.89420.
If you agree with this analysis or have any additional insights, feel free to share your thoughts in the comments!

Potential bullish bounce?USD/CHF is falling towards the support level which is a pullback support that is slightly above the 38.2% Fibonacci retracement and could bounce from this level to our take profit.
Entry: 0.9134
Why we like it:
There is a pullback support level that is slightly above the 38.2% Fibonacci retracement.
Stop loss: 0.9098
Why we like it:
There is an overlap support level that is slightly below the 50% Fibonacci retracement.
Take profit: 0.9188
Why we like it:
there is a pullback resistance level.
Enjoying your TradingView experience? Review us!
Please be advised that the information presented on TradingView is provided to Vantage (‘Vantage Global Limited’, ‘we’) by a third-party provider (‘Everest Fortune Group’). Please be reminded that you are solely responsible for the trading decisions on your account. There is a very high degree of risk involved in trading. Any information and/or content is intended entirely for research, educational and informational purposes only and does not constitute investment or consultation advice or investment strategy. The information is not tailored to the investment needs of any specific person and therefore does not involve a consideration of any of the investment objectives, financial situation or needs of any viewer that may receive it. Kindly also note that past performance is not a reliable indicator of future results. Actual results may differ materially from those anticipated in forward-looking or past performance statements. We assume no liability as to the accuracy or completeness of any of the information and/or content provided herein and the Company cannot be held responsible for any omission, mistake nor for any loss or damage including without limitation to any loss of profit which may arise from reliance on any information supplied by Everest Fortune Group.

Trade Idea: USDCHF BuyTrade Idea: USDCHF Buy
Higher Timeframe Analysis:
Liquidity Context:
Identify a liquidity pool below a key low or a swing point on the 1H or 4H chart. Price should have tapped or swept liquidity without a deep retracement, signaling bullish intent.
Order Flow Alignment:
Confirm that price action shows bullish overlapping order flow (higher lows forming progressively closer to liquidity levels).

USDCHF1# Dow theory Bulish making HH and HL.
2# no divergence 1H time frame .
3# 0.618 test fib level.
4# Bulish hammer at fib level 0.618
Entry price 0.89824
SL: 0.88953
TP: 0.90695
RRR 1:1

USDCHF is in the overbought territoryUSDCHF the Stochastic Oscillator indicates that the pair is in the overbought territory, which might lead to a short-term pullback. if we broke 0.91444, next scalp target is 0.90972. is currently showing a bullish trend on the 4-hour time frame but upside is limited by 0.92123-0.92242 area. So soon maybe we will get a reversal bias.

USD CHF Bullish trendUSDCHF Bullish trend with entry price /buy stop and stop loss
Tp1 and Tp2 defined

Dollar Set to rally Before Trump is in office? #USDCHF UPDATEIn this video, we provided a quick update on our USDCHF trade that we analyzed and entered yesterday. We took some profits, broke even on the original position, and added a new position for a short-term play.
We still anticipate higher prices for the USD Dollar overall, especially as we approach President Trump’s upcoming term in office.
If you found this video helpful and want to see more like it, be sure to boost, follow, and share with your fellow traders.
Have a specific pair you’d like us to analyze? Drop it in the comments, and we’ll do our best to cover it this weekend.
Happy trading, and enjoy your weekend!

USDCHF - Bullish TradePrice is moving in bullish trend with channel support.
Entry is at fib value 0.618.
SL is below last Higher Low.

USDCHF LONGBased on technical analysis this will be a good chance to get in an steal some pips. I would expect this to be completed by middle of NY sessions tomorrow.

Dollar rally continues, but until when?As of January 10, 2025, the USD/CHF currency pair is trading around 0.9137, reflecting a 1.5% increase from the previous close.
Technical analysis indicates that the pair is within a bullish channel, with the next resistance level at 0.9223. Support is observed at 0.8956, which, if breached, could signal a potential trend reversal.
The Relative Strength Index (RSI) suggests that the pair is not currently overbought, indicating room for further upward movement.
Analysts recommend monitoring economic indicators from both the U.S. and Switzerland, as these can significantly influence the pair's direction. Additionally, global risk sentiment and geopolitical developments may impact the USD/CHF exchange rate.


USDCHF Is Very Bearish! Sell!
Here is our detailed technical review for USDCHF.
Time Frame: 4h
Current Trend: Bearish
Sentiment: Overbought (based on 7-period RSI)
Forecast: Bearish
The market is approaching a key horizontal level 0.913.
Considering the today's price action, probabilities will be high to see a movement to 0.909.
P.S
We determine oversold/overbought condition with RSI indicator.
When it drops below 30 - the market is considered to be oversold.
When it bounces above 70 - the market is considered to be overbought.
Like and subscribe and comment my ideas if you enjoy them!

USD/CHF H1 | Bullish uptrend to extend?USD/CHF is falling towards a swing-low support and could potentially bounce off this level to climb higher.
Buy entry is at 0.9111 which is a swing-low support.
Stop loss is at 0.9090 which is a level that lies underneath an overlap support and the 23.6% Fibonacci retracement level.
Take profit is at 0.9136 which is a swing-high resistance.
High Risk Investment Warning
Trading Forex/CFDs on margin carries a high level of risk and may not be suitable for all investors. Leverage can work against you.
Stratos Markets Limited (www.fxcm.com):
CFDs are complex instruments and come with a high risk of losing money rapidly due to leverage. 64% of retail investor accounts lose money when trading CFDs with this provider. You should consider whether you understand how CFDs work and whether you can afford to take the high risk of losing your money.
Stratos Europe Ltd (www.fxcm.com):
CFDs are complex instruments and come with a high risk of losing money rapidly due to leverage. 66% of retail investor accounts lose money when trading CFDs with this provider. You should consider whether you understand how CFDs work and whether you can afford to take the high risk of losing your money.
Stratos Trading Pty. Limited (www.fxcm.com):
Trading FX/CFDs carries significant risks. FXCM AU (AFSL 309763), please read the Financial Services Guide, Product Disclosure Statement, Target Market Determination and Terms of Business at www.fxcm.com
Stratos Global LLC (www.fxcm.com):
Losses can exceed deposits.
Please be advised that the information presented on TradingView is provided to FXCM (‘Company’, ‘we’) by a third-party provider (‘TFA Global Pte Ltd’). Please be reminded that you are solely responsible for the trading decisions on your account. There is a very high degree of risk involved in trading. Any information and/or content is intended entirely for research, educational and informational purposes only and does not constitute investment or consultation advice or investment strategy. The information is not tailored to the investment needs of any specific person and therefore does not involve a consideration of any of the investment objectives, financial situation or needs of any viewer that may receive it. Kindly also note that past performance is not a reliable indicator of future results. Actual results may differ materially from those anticipated in forward-looking or past performance statements. We assume no liability as to the accuracy or completeness of any of the information and/or content provided herein and the Company cannot be held responsible for any omission, mistake nor for any loss or damage including without limitation to any loss of profit which may arise from reliance on any information supplied by TFA Global Pte Ltd.
The speaker(s) is neither an employee, agent nor representative of FXCM and is therefore acting independently. The opinions given are their own, constitute general market commentary, and do not constitute the opinion or advice of FXCM or any form of personal or investment advice. FXCM neither endorses nor guarantees offerings of third-party speakers, nor is FXCM responsible for the content, veracity or opinions of third-party speakers, presenters or participants.

USDCHF: Bullish Momentum Set to RiseThe USDCHF pair is poised for upward movement, with a recommended entry price of 0.91221. We anticipate a target price of 0.91359333 while setting a stop loss at 0.91028333. This bullish outlook stems from a combination of technical indicators and overall market sentiment that aligns with the EASY Trading AI strategy.
Market analysis shows a strong support level near our entry price, coupled with recent positive economic data from the U.S. that has boosted the dollar's strength. Additionally, the Swiss franc appears under pressure due to ongoing monetary policy from the Swiss National Bank, which has not been favorable for the currency.
Moreover, the price action has confirmed a pattern that indicates potential upward movement, further validated by trend analysis tools within the EASY Trading AI framework. These assessments suggest that buyers are gaining momentum, making the current price an advantageous entry point for traders looking to capitalize on this trend.
In conclusion, positioning ourselves for a buy in USDCHF aligns with the prevailing market conditions, and the set parameters for take profit and stop loss provide a balanced risk-reward ratio ideal for both novice and experienced traders. Happy trading!

USD CHFConfirmation in pattern, trend and pullback indicator on buy
It is not investment advice, nor am I looking to raise money, it IS analysis

USD-CHF Short From Resistance! Sell!
Hello,Traders!
USD-CHF is trading in an
Uptrend but the pair will
Soon hit a strong horizontal
Resistance of 0.9158 from
Where we will be expecting
A local bearish correction
Sell!
Comment and subscribe to help us grow!
Check out other forecasts below too!

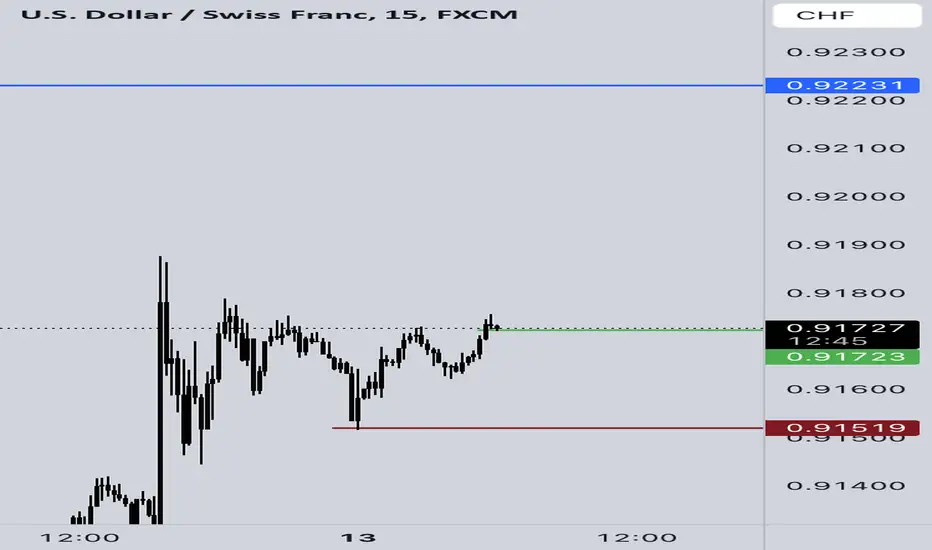
Could the price reverse from here?USD/CHF is currently reacting to the resistance level, which is a pullback resistance. A reversal from this level could indicate a double-top pattern, potentially leading to a price drop toward our take-profit target.
Entry: 0.9136
Why we like it:
There is a pullback resistance level.
Stop loss: 0.9173
Why we like it:
There is a resistance level at the 127.2% Fibonacci extension.
Take profit: 0.9058
Why we like it:
There is a pullback support level that lines up with the 61.8% Fibonacci retracement.
Enjoying your TradingView experience? Review us!
Please be advised that the information presented on TradingView is provided to Vantage (‘Vantage Global Limited’, ‘we’) by a third-party provider (‘Everest Fortune Group’). Please be reminded that you are solely responsible for the trading decisions on your account. There is a very high degree of risk involved in trading. Any information and/or content is intended entirely for research, educational and informational purposes only and does not constitute investment or consultation advice or investment strategy. The information is not tailored to the investment needs of any specific person and therefore does not involve a consideration of any of the investment objectives, financial situation or needs of any viewer that may receive it. Kindly also note that past performance is not a reliable indicator of future results. Actual results may differ materially from those anticipated in forward-looking or past performance statements. We assume no liability as to the accuracy or completeness of any of the information and/or content provided herein and the Company cannot be held responsible for any omission, mistake nor for any loss or damage including without limitation to any loss of profit which may arise from reliance on any information supplied by Everest Fortune Group.

USD/CHF SHORT!Short-Term Sell Setup on USD/CHF with Excellent Risk-Reward Ratio
The USD/CHF pair appears to be forming a potential double top, suggesting that the price might struggle to break above this resistance level. This setup offers a strong short-term opportunity with an excellent risk-reward ratio for sellers.
Good luck to everyone!

Is the Dollar Set to rally Before Trump is in office? #USDCHF In this video I go in depth as to why we believe we are set to see higher prices on USDCHF and the US Dollar as a whole.
On the monthly timeframe we can see a large ranging market for USDCHF but we believe this time it will different. Check out the video to find out why in detail! - @BlueOceanFx

USDCHF mixed sentiment but bullish momentum nearing resistanceBesides surprising the market in early December with a larger-than-expected rate cut of 50bps, the Swiss National Bank (SNB) has a tough road to navigate.
The USD/CHF daily chart shows a bullish recovery, marked by higher highs and higher lows, signalling a shift from a bearish trend. Volatility remains moderate, with steady price movement and controlled pullbacks. Indicators like the MACD show bullish momentum across timeframes, supported by a positive ADX reading highlighting buying pressure dominance. Oscillators suggest room for upward movement, as no overbought conditions are present. Key structural points, such as multiple Breaks of Structure (BOS), confirm the bullish bias, while intraday Changes of Character (ChoCH) hint at short-term volatility.
CHF Bullish Thesis
The ongoing geopolitical risks, upcoming trade tensions with the Trump administration, and fears of the Euro Zone recession would likely bolster demand for the Swiss Franc as volatility picks up. If there should be a change in sentiment relating to U.S. economic growth or global slowdown, we could expect the CHF to strengthen based on historical global risk-off periods.
CHF Bearish Thesis
A combination of the ECB out-cutting the SNB and a potential negative rate in Switzerland would spur on the USD carry trader, putting upward pressure on the USDCHF pair. Additionally, with the SNB front loading, a dovish stance may be pre-emptive as the Federal Reserve adjust expectations of more than 2 rate cuts in 2025. A somewhat hawkish stance by the Federal Reserve may lead to the dollar outperforming the Franc in a prolonged deflationary environment, particularly if moderate growth is reached in the United States.
1-Hour Chart Setup (Swing Trade):
Entry: Long near 0.9080-0.9100 (hourly demand zone).
Stop-Loss: Below 0.9050 (structure low).
Target 1: 0.9150 (short-term resistance).
Target 2: 0.9200 (strong daily resistance).
Risk/Reward: ~1:3.
Rationale:
The 0.9080-0.9100 demand zone provides an optimal entry point for a low-risk, high-reward trade as it aligns with structural support.
Setting the stop-loss below 0.9050 ensures protection against a reversal below the current structure low.
Targets at 0.9150 and 0.9200 align with visible resistance levels, offering logical profit-taking zones while maintaining a favorable risk/reward ratio (~1:3).
Daily Chart Setup (Position Trade):
Entry: Buy pullbacks near 0.9000-0.9050 (daily support).
Stop-Loss: Below 0.8900 (protect against bearish breakout).
Target 1: 0.9200 (key resistance).
Target 2: 0.9400 (long-term range extension).
Risk/Reward: ~1:4.
Rationale:
A pullback to the 0.9000-0.9050 zone offers a favorable entry aligned with the broader bullish trend.
The stop-loss placed below 0.8900 protects against a deeper bearish breakout while maintaining reasonable downside risk.
Targets at 0.9200 (key resistance) and 0.9400 (long-term range extension) align with significant levels on the daily chart, providing opportunities for a high-risk/reward trade (~1:4).
Bearish Trade Idea for USD/CHF
While the broader trend is bullish, visible resistance at 0.9200 and intraday Changes of Character (ChoCH) indicate potential for short-term bearish reversals, especially near overextended levels.
Entry: Look for rejection at the 0.9150-0.9200 resistance zone (previous highs). Confirm entry with bearish price action signals, such as a bearish engulfing candlestick or ChoCH.
Stop-Loss: Place above 0.9225, allowing for a false breakout above resistance.
Target 1: 0.9100 (key intraday support).
Target 2: 0.9050 (deeper retracement level and daily demand zone).
Risk/Reward: Approximately 1:2.
Rationale:
Resistance at 0.9200 aligns with prior highs, where selling pressure could emerge.
Bearish signals at this level would indicate short-term profit-taking or a deeper retracement.
The information provided in this research is for educational and informational purposes only and should not be construed as financial advice or a recommendation to trade any specific security, currency pair, or financial instrument. Trading and investing in financial markets involve significant risk, including the potential loss of principal, and may not be suitable for all investors.
While every effort has been made to ensure the accuracy and reliability of the information presented, the author and publisher make no representations or warranties as to its completeness or suitability for any particular purpose. Past performance is not indicative of future results, and market conditions are subject to rapid changes.
You should conduct your own research and consult with a licensed financial advisor or other qualified professional before making any trading or investment decisions. The author and publisher shall not be held liable for any loss or damage, directly or indirectly, arising from the use of or reliance on this research.
By accessing or using this information, you acknowledge that you understand the risks involved and accept full responsibility for any trading or investment activities you undertake.

Trend Alignment on USDCHFbased off the technical timeframe trend alignment, you have the probabilities of trading the bullish triangle breakout and the trend moving in your favor.
Trade during session opens
Trade only if you see Volume step in and a large candlestick formation.
