Dollar dominant USD/CHF keeping its bullish price series. break out and retest of 0.9030 market structure retested. now a run up towards target 1 at 0.9230 then target 2 at 0.9740
USDCHF.1.MINI trade ideas

USDCHF SELL ANALYSIS SMART MONEY CONCEPT Here on Usdchf price has made a supply around level of 0.91230 and is likely to continue going down so trader should go for short with expect profit target of 0.89091 and 0.86654 . Use money management

USDCHF SELL ANALYSIS RISING WEDGE PATTERN Here on Usdchf price form a rising wedge pattern and now try to move down as line 0.90589 break so trader should go for short with expect profit target of 0.89558 .Use money management

USDCHF# => OPTIONS => TODAY => DAY -1 => 4H
1 Instrument USD/CHF => USD/CHF => USD/CHF
2 Signal strength => 28% => 46% => 59%
3 TA applicability => 17% => 17% => 98%
4 Total signal value => 5% => 8% => 58%
5 Rank (# from 28) => 19 => 12 => 3
6 Signal direction => SHORT => SHORT => SHORT
7 Timeframe, H => 24 => 24 => 4
8 LONG => 49% => 61% => 13%
9 SHORT => 21% => 16% => 72%
10 NEUTRAL => 29% => 23% => 16%
11 Time => 27.01.2025 19:58 => 27.01.2025 19:24 => 27.01.2025 20:43
12 TA strategies => 174 => 174 => 204
13 Win-rate => 63% => 64% => 83%
14 Trading days => 7 => 6 => 0
15 Current profit => 1.11% => 0.52% => 0.00%
16 Enter Price => 0.9004 => 3.9630 => 0.7931
17 Stop Loss => 0.9091 => 0.9087 => 0.9063
18 Take profit => 0.8831 => 0.8827 => 0.8924
18 ATR (Stop/Loss) 1.5 => 1.5 => 1.5
19 Bars for analysis 2700 => 2700 => 1984

USD_CHF LONG FROM RISING SUPPORT|LONG|
✅USD_CHF is trading along the rising support
And as the pair will soon retest it
I am expecting the price to go up
To retest the supply levels above at 0.9104
LONG🚀
✅Like and subscribe to never miss a new idea!✅

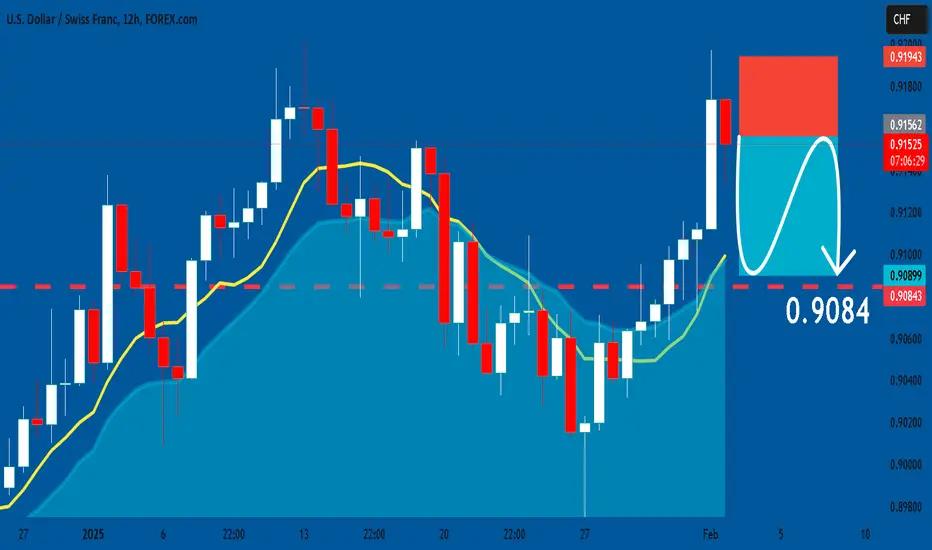
USDCHF: Short Trade with Entry/SL/TP
USDCHF
- Classic bearish formation
- Our team expects pullback
SUGGESTED TRADE:
Swing Trade
Short USDCHF
Entry - 0.9155
Sl - 0.9194
Tp - 0.9084
Our Risk - 1%
Start protection of your profits from lower levels
❤️ Please, support our work with like & comment! ❤️
BULLS ARE STILL IN THE CONTROL Following Price action, we can see that structure indicates where Liquidity is located. Therefore, based on confirmation entry is will be buying.


USDCHF is BearishPrice was in a strong uptrend, however the bulls seem to be exhausted now as a double top formation with bearish divergence is formed. This means that bears are waking up and trying to assume control of price action. If previous higher low is broken successfully then we can expect a bearish reversal as per Dow theory. Targets are mentioned on the chart.

USDCHF buysLooking to take buys after a sweep of liquidity and tap into the POI, an orderblock.
Sweet trendline liquidity target above as well
Trade safe🥂

USDCHF: Should we look for a weaker franc?!The USDCHF pair is located between the EMA200 and EMA50 on the 4-hour timeframe and is moving in its ascending channel. In case of a downward correction towards the demand zone, we will be provided with further buying positions in this pair with an appropriate risk-reward ratio.
The continuation of the pair’s rise and its placement in the supply zone will provide us with a selling position.
The President of the Swiss National Bank (SNB), Schlegel, stated in an interview with SRF that while the SNB does not favor negative interest rates, it also cannot completely rule them out. He emphasized that implementing such a policy would not be a decision taken lightly.
In recent weeks, Schlegel has repeatedly mentioned the possibility of negative interest rates, particularly in light of Switzerland’s inflation dropping to 0.6% in December, which has raised concerns about deflation. However, he noted that temporary periods of negative inflation would not necessarily pose a problem.Additionally, Schlegel reaffirmed the SNB’s commitment to maintaining price stability over the medium term, within the 0–2% target range.
Currently, market expectations indicate a 60% probability that the SNB will cut interest rates from 0.5% to 0.25% in March, with a 25% chance of rates reaching 0% by June.
In the United States, GDP data for Q4 2024 showed that the economy grew at an annualized 2.3% rate—below market expectations (2.6%) and lower than the 3.1% growth seen in the previous quarter. However, a 2.5% year-over-year growth rate remains substantial and aligns with the Federal Reserve’s outlook.
A key takeaway from the recent GDP report is the strong performance of U.S. consumers, who exceeded expectations with 4.2% growth in spending. According to CIBC, American consumers have shown a notable preference for durable goods, with spending in this category surging 12.1% last quarter—a figure significantly above pre-pandemic trends.
However, CIBC warns that other sectors of the economy are not as strong. Business investments remain weak, and government spending has played a crucial role in supporting economic growth. Additionally, a 0.9% decline in inventories, driven by weather disruptions and labor strikes, has negatively impacted GDP growth.
These factors are expected to persist into Q1 2025, as businesses stockpile inventory ahead of potential tariffs. However, when stripping out inventory effects, final sales to domestic buyers remain strong at 3.1%, which is nearly in line with the two-year average.
CIBC also believes that consumer spending will remain resilient, supported by rising asset-related incomes and millennials’ enthusiasm for technology and discretionary spending. That said, trade tariffs could ultimately shave 1% off GDP growth, with their effects likely to linger for some time.
Overall, CIBC concludes that while GDP growth may slow slightly under a Trump presidency, the decline is unlikely to cause major concern for the Federal Reserve. Fed Chair Jerome Powell remains more focused on rising prices, their impact on inflation expectations, and wage pressures, as the economy remains strong but inflation is not yet fully controlled.
Today’s data reinforces the Fed’s data-dependent approach. Underlying growth is still around 3%, and there is no indication that consumers are scaling back spending, suggesting that they can absorb moderate price increases.
As a result, Nomura now expects the Federal Reserve to keep interest rates unchanged through the end of 2025, revising its earlier forecast, which had anticipated at least one rate cut in 2025.

An extended growthDollar Franc has been growing since August 2024, and is in a position to possibly extend this expansion. Price action is retesting the 0.92000 barrier, after reach it this month, January 2025. If the pair remains below this barrier, price may begin transitioning into a bearish trend.
However, if the current surge manages to breakthrough with an attitude of stabilizing above the resistance zone. An expansion of price is likely going to happen. If it does break and continue up. The above resistance zones may be areas where price action will probably correct, possibly settling a bit (days/weeks) and then continue up to the established W and M tops.
Price action is ranging with a Monthly correction phase.

Potential back to SouthVery strong Weekly resistance zone that has recently been tested twice. Head and shoulder pattern can reveal itself. Be patient to see price break the latest 4h uptrend line that coincide with right shoulder. Once that happens, be ready to sell on pull back.

28.01.25 Morning ForecastPairs on Watch -
FX:USDCHF
FX:EURUSD
FX:AUDUSD
A short overview of the instruments I am looking at for today, multi-timeframe analysis down to what I will be looking at for an entry. Enjoy!

Usdchf buy soon5 leg sequence reversal. 3 leg sequence wasn’t respected. Usd bit unpredictable due to new presidency

USD/CHF | Bearish Season IncomingHigher timeframes (3-Day+) are at a nice resistance zone to see short plays only as we head into the next season
We got a ~600 pip swing but first I'd like to see maybe one more long position back to the main resistance zone for a high sell entry up top and then scaling in as price falls after more confirmation and price development
Trend Reader is looking nice too as its in the overbought zone signaling a bearish play to come with clear divergence
The blue EMA at around 150-Days also acts as good dynamic Support/Resistance to help confirm that flipside once price looks to break below with a rejected pullback.

USDCHF - 1hr ( Intra Day Sell Target range 120 PIP ) The USD/CHF currency pair, analyzed within the context of a one-hour chart and utilizing a large-scale perspective, presents a critical bearish outlook following a significant breakout from a key level identified at 0.90800. This pivotal point, marked by high trading volume, serves as an essential indicator for potential downward momentum in the market. Traders should closely monitor price movements around this level, as sustained trading below 0.90800 may confirm the bearish sentiment and signal further declines. Conversely, any failure to maintain this breakout could indicate a potential reversal, necessitating a reassessment of market conditions.
☑️ Pair Name : USD/CHF
Time Frame : 1hrs Chart / Close
Scale Type : Large Scale
Best Break Our / Key level's 1hr Tf
☑Bearish After Break Out key level + High Volume / 0.90800 Point

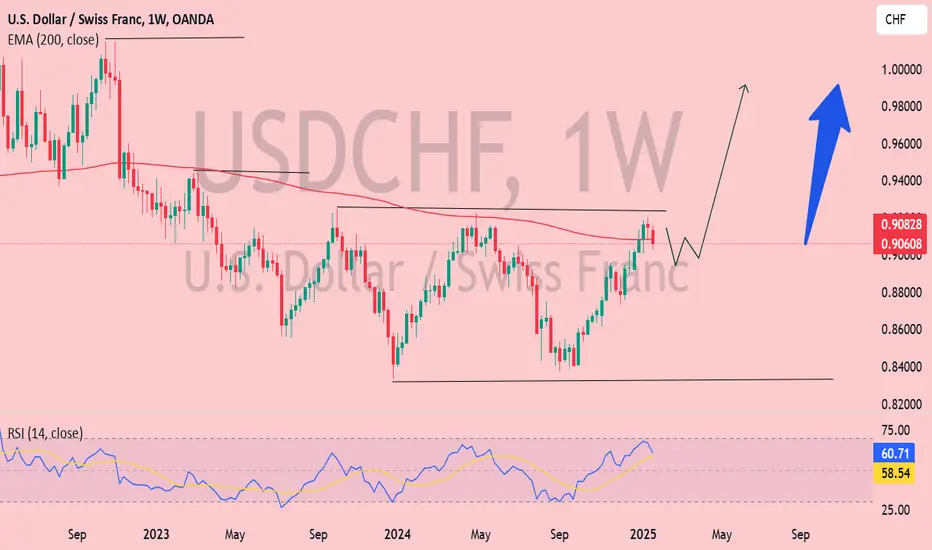
USD/CHF Poised for a Bullish Breakout: Path to Parity Bullish Scenario 🚀📈
1. Breakout Above the EMA (200) 🔺:
If the price closes above the 200-week EMA (0.9082), it could confirm a long-term bullish trend reversal.
A strong push may target key levels like 0.9500 and eventually 1.0000 (parity) 🎯, as shown by the projection arrow.
2. RSI Support 💪:
The RSI above 50 indicates that buyers are gaining momentum.
If RSI trends toward 70, it signals even stronger bullish momentum ✅📊.
3. Higher Highs and Higher Lows 📶:
The chart is forming higher highs and higher lows, a classic signal of an uptrend.
This pattern supports a move toward higher price levels 🚀.
🔥 Key Takeaway: A breakout above the EMA could spark a powerful rally, with parity (1.0000) as a major psychological target.
USDCHF H4 | Bullish Rise Based on the H4 chart, the price is approaching our buy entry level at 0.9008, which aligns with an overlap support level and the 161.8% Fibonacci extension. This level is expected to act as a potential reversal point in the bullish setup.
Our take profit is set at 0.9091, near a key resistance level where price may face selling pressure.
The stop loss is placed at 0.8946, below the 127.2% Fibonacci extension, providing room for price fluctuations while ensuring the bullish setup remains valid.
High Risk Investment Warning
Trading Forex/CFDs on margin carries a high level of risk and may not be suitable for all investors. Leverage can work against you.
Stratos Markets Limited (www.fxcm.com):
CFDs are complex instruments and come with a high risk of losing money rapidly due to leverage. 64% of retail investor accounts lose money when trading CFDs with this provider. You should consider whether you understand how CFDs work and whether you can afford to take the high risk of losing your money.
Stratos Europe Ltd, previously FXCM EU Ltd (www.fxcm.com):
CFDs are complex instruments and come with a high risk of losing money rapidly due to leverage. 66% of retail investor accounts lose money when trading CFDs with this provider. You should consider whether you understand how CFDs work and whether you can afford to take the high risk of losing your money.
Stratos Trading Pty. Limited (www.fxcm.com):
Trading FX/CFDs carries significant risks. FXCM AU (AFSL 309763), please read the Financial Services Guide, Product Disclosure Statement, Target Market Determination and Terms of Business at www.fxcm.com
Stratos Global LLC (www.fxcm.com):
Losses can exceed deposits.
Please be advised that the information presented on TradingView is provided to FXCM (‘Company’, ‘we’) by a third-party provider (‘TFA Global Pte Ltd’). Please be reminded that you are solely responsible for the trading decisions on your account. There is a very high degree of risk involved in trading. Any information and/or content is intended entirely for research, educational and informational purposes only and does not constitute investment or consultation advice or investment strategy. The information is not tailored to the investment needs of any specific person and therefore does not involve a consideration of any of the investment objectives, financial situation or needs of any viewer that may receive it. Kindly also note that past performance is not a reliable indicator of future results. Actual results may differ materially from those anticipated in forward-looking or past performance statements. We assume no liability as to the accuracy or completeness of any of the information and/or content provided herein and the Company cannot be held responsible for any omission, mistake nor for any loss or damage including without limitation to any loss of profit which may arise from reliance on any information supplied by TFA Global Pte Ltd.
The speaker(s) is neither an employee, agent nor representative of FXCM and is therefore acting independently. The opinions given are their own, constitute general market commentary, and do not constitute the opinion or advice of FXCM or any form of personal or investment advice. FXCM neither endorses nor guarantees offerings of third party speakers, nor is FXCM responsible for the content, veracity or opinions of third-party speakers, presenters or participants.

USDCHF_30M_BuyAnalysis of the Swiss Franc In the short and medium term, it is possible to form a top floor pattern. If the price is above 0.90700 and maintains this number as support, it can enter an upward wave and move towards 0.90970 and 0.91100.

USDCHF BEARISHUSDCHF print LL%LH IN bearish trend
at current price its on good 0.61% fib level
no reversal sign
good for sell

Heading into overlap resistance?The Swissie is rising towards the pivot which has been identified as an overlap resistance and could drop to the 1st support which acts as an overlap support.
Pivot: 0.9092
1st Support: 0.9011
1st Resistance: 0.9152
Risk Warning:
Trading Forex and CFDs carries a high level of risk to your capital and you should only trade with money you can afford to lose. Trading Forex and CFDs may not be suitable for all investors, so please ensure that you fully understand the risks involved and seek independent advice if necessary.
Disclaimer:
The above opinions given constitute general market commentary, and do not constitute the opinion or advice of IC Markets or any form of personal or investment advice.
Any opinions, news, research, analyses, prices, other information, or links to third-party sites contained on this website are provided on an "as-is" basis, are intended only to be informative, is not an advice nor a recommendation, nor research, or a record of our trading prices, or an offer of, or solicitation for a transaction in any financial instrument and thus should not be treated as such. The information provided does not involve any specific investment objectives, financial situation and needs of any specific person who may receive it. Please be aware, that past performance is not a reliable indicator of future performance and/or results. Past Performance or Forward-looking scenarios based upon the reasonable beliefs of the third-party provider are not a guarantee of future performance. Actual results may differ materially from those anticipated in forward-looking or past performance statements. IC Markets makes no representation or warranty and assumes no liability as to the accuracy or completeness of the information provided, nor any loss arising from any investment based on a recommendation, forecast or any information supplied by any third-party.

USD/CHF POTENTIAL SETUPUSD/CHF 15M - I am also looking to short this market, as we know its a bearish market on the higher timeframes and recently price has been pulling back to clear the inefficient structure.
Price has gone and traded into a clear Order Block here on the 15M and we have seen price begin distributing, putting in this ranging data, this usually suggests a prep to move to the downside.
In order for me to seek full validation to short this market we want to see a break in the last protected low within the bullish structure that the corrective wave has put in, I have gone ahead and marked that out.
But for those who want a more aggressive approach we could look to enter in sooner with price respecting areas of Supply and clearing liquidity to the upside, I will go ahead and post a potential entry that is more aggressive whilst keeping our parameters in check.
