USDCHFhi everyone
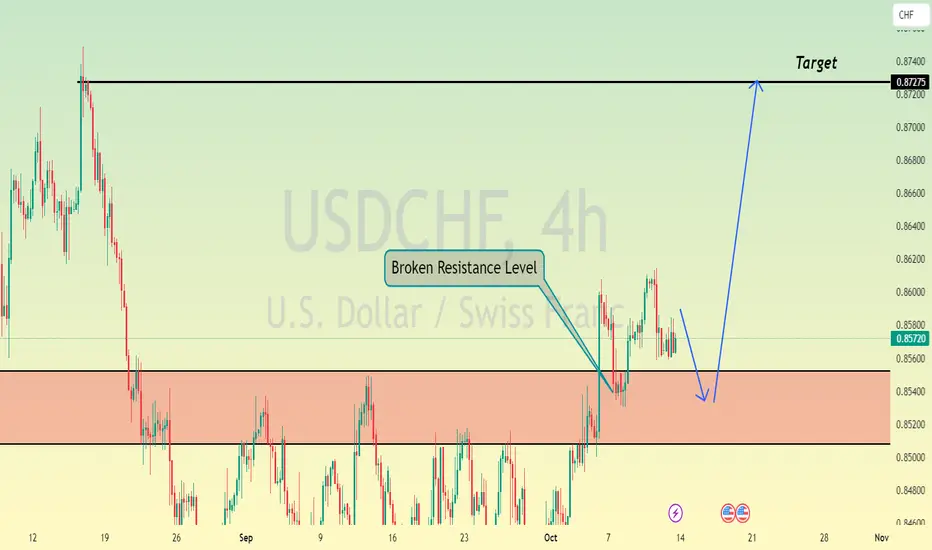
here i just share about 'breakout' strategy
in my speculation,
after break resist, next trend will be uptrend?
disclaimer
this is not a signal
i just share what i see
thanksyou
USDCHF.1.MINI trade ideas

USDCHF is reacting to WEEKLY demand while trend is bearishPrice has been bearish for 2 quarters and suddenly broke above $0.855🔴 giving bullish internal structure. Price closed higher last week forming a weekly FVG waiting to be filled. We have a weekly supply zone that broke structure and is UNMITIGATED. We also have an UNMITIGATED demand zone formed after bullish break of structure. An entry zone has formed!
Entry 1⬆️ (bullish):
-Keeping in mind that price is bearish, we can look to enter at our marked demand zone and target our UNMITIGATED SUPPLY
Entry 2⬇️ (bearish):
- Keeping in mind that price reacted to a Weekly demand zone+price is bearish overall, We can enter our shorts at our UNMITIGATED supply zone and target our fresh swing low for liquidity raid. Assuming price is moving from internal to external liquidity

USDCHFThe dollar to franc currency pair in the daily time frame is prone to good growth from the wave and channel point of view, although from the fundamental point of view, which is the most important reason for us to enter the transaction, it also justifies this rise due to the interest rate reduction cycle and the strength of the American labor market.

USDCHFThe dollar to franc currency pair is prone to good growth in the daily time frame from the point of view of wave and channel

USDCHF H1 I Bullish Bounce Based on the H4 chart analysis, we can see that the price is currently at our buy area of 0.8579, which is a pullback support level.
Our take profit will be at 0.8597, which is a pullback resistance level close to the 78.60% Fibonacci retracement.
The stop loss will be placed at 0.8559, which is an overlap support level.
High Risk Investment Warning
Trading Forex/CFDs on margin carries a high level of risk and may not be suitable for all investors. Leverage can work against you.
Stratos Markets Limited (www.fxcm.com):
CFDs are complex instruments and come with a high risk of losing money rapidly due to leverage. 68% of retail investor accounts lose money when trading CFDs with this provider. You should consider whether you understand how CFDs work and whether you can afford to take the high risk of losing your money.
Stratos Europe Ltd, previously FXCM EU Ltd (www.fxcm.com):
CFDs are complex instruments and come with a high risk of losing money rapidly due to leverage. 73% of retail investor accounts lose money when trading CFDs with this provider. You should consider whether you understand how CFDs work and whether you can afford to take the high risk of losing your money.
Stratos Trading Pty. Limited (www.fxcm.com):
Trading FX/CFDs carries significant risks. FXCM AU (AFSL 309763), please read the Financial Services Guide, Product Disclosure Statement, Target Market Determination and Terms of Business at www.fxcm.com
Stratos Global LLC (www.fxcm.com):
Losses can exceed deposits.
Please be advised that the information presented on TradingView is provided to FXCM (‘Company’, ‘we’) by a third-party provider (‘TFA Global Pte Ltd’). Please be reminded that you are solely responsible for the trading decisions on your account. There is a very high degree of risk involved in trading. Any information and/or content is intended entirely for research, educational and informational purposes only and does not constitute investment or consultation advice or investment strategy. The information is not tailored to the investment needs of any specific person and therefore does not involve a consideration of any of the investment objectives, financial situation or needs of any viewer that may receive it. Kindly also note that past performance is not a reliable indicator of future results. Actual results may differ materially from those anticipated in forward-looking or past performance statements. We assume no liability as to the accuracy or completeness of any of the information and/or content provided herein and the Company cannot be held responsible for any omission, mistake nor for any loss or damage including without limitation to any loss of profit which may arise from reliance on any information supplied by TFA Global Pte Ltd.
The speaker(s) is neither an employee, agent nor representative of FXCM and is therefore acting independently. The opinions given are their own, constitute general market commentary, and do not constitute the opinion or advice of FXCM or any form of personal or investment advice. FXCM neither endorses nor guarantees offerings of third party speakers, nor is FXCM responsible for the content, veracity or opinions of third-party speakers, presenters or participants.

Weekly Pivot (14-19)The weekly pivot includes key support and resistance levels calculated based on last week's price data. Crossing above the mid-pivots can increase the likelihood of the current trend strengthening.
Price movement above the pivots: Indicates a strengthening bullish trend and the potential for continuation.
Price movement below the pivots: May indicate selling pressure and a weakening bullish trend.

USDCHF will be in the Bullish direction after testing SupportHello Traders
In This Chart USDCHF HOURLY Forex Forecast By FOREX PLANET
today USDCHF analysis 👆
🟢This Chart includes_ (USDCHF market update)
🟢What is The Next Opportunity on USDCHF Market
🟢how to Enter to the Valid Entry With Assurance Profit
This CHART is For Trader's that Want to Improve Their Technical Analysis Skills and Their Trading By Understanding How To Analyze The Market Using Multiple Timeframes and Understanding The Bigger Picture on the Chart
Usdchf dropping area confirm sell read the caption week ago today, the USDCHF made a break to the upside and out of the "Red Box" that had confined the pair going back to August 20. The US jobs report was the catalyst for the move higher, but by Monday, the price fell back to the high of that "red box" and even moved within the topside edges of it.
Sellers should have entered on that breach, but the momentum was very modest, and sellers turned back to buyers into Tuesday and reached session - and week - highs on late Wednesday and into Thursday's trade. Those highs reached a swing area between 0.86078 and 0.8619. The high price reached 0.86067.

USD_CHF WILL GO UP|LONG|
✅USD_CHF has retested a support level of 0.8550
And we are seeing a bullish reaction
With the price going up but we need
To wait for a confirmation
Before entering the trade, so that we
Get a higher success probability of the trade
LONG🚀
✅Like and subscribe to never miss a new idea!✅

USDCHF 10/13~10/21We've entered Wave 5 of this run. It may or may not hit the extended Wave 5, so be mindful of the second long position.

USDCHF is bullish until next UNMITIGATED SUPPLY ZONEWe have been experiencing bullish orderflow for 2 weeks in a row this month. However, we have an UNMITIGATED 4h DEMAND ZONE below previous week low. We can anticipate entry if price pulls back to the zone.
Buy model anticipated: SELLSIDE MANIPULATION AND REVERSAL
We expect price to take out static liquidity (inducement) and continue with the dominant Bullish trend until next UNMITIGATED SUPPLY ZONE.

USD-CHF Bullish Bias! Buy!
Hello,Traders!
USD-CHF is trading in a
Local uptrend and the pair
Is consolidating above
The horizontal support
Of 0.8550 so we are
Locally bullish biased
And we will be expecting
A further move up
Buy!
Like, comment and subscribe to help us grow!
Check out other forecasts below too!

Read The USDCHF MarketLet's Looking at USDCHF Chart and Decide to What can we do with the Market in next week, Good luck With Your Trades <3

USDCHF Trading Opportunity! SELL!
My dear friends,
USDCHF looks like it will make a good move, and here are the details:
The market is trading on 0.8576 pivot level.
Bias - Bearish
Technical Indicators: Supper Trend generates a clear short signal while Pivot Point HL is currently determining the overall Bearish trend of the market.
Goal - 0.8530
Recommended Stop Loss - 0.8601
About Used Indicators:
Pivot points are a great way to identify areas of support and resistance, but they work best when combined with other kinds of technical analysis
———————————
WISH YOU ALL LUCK

USDCHF UpdateThis is not a financial advice its only my own analysis and what I think this pair will do in the near future on H1 Timeframe
Follow us for more updates

CPI to Knock It OffFundamentals & Sentiment
USD:
- Undervalued according to many market internals
- CPI Beat
- Monster jobs data (NFP, Unemployment, etc.)
- Risks: Initial claims beat - the market might see it dovish
CHF:
- Generally, the franc is too expensive for SNB's liking
- Bearish Internals
Technical & Other
Setup: S(B)
Setup timeframe: 4h
Trigger: 4h
Medium-term: Range
Long-term: Down
Min target: Aug highs
Stop loss: 0.36%
Position size: 0.8R
*Buy limit
