USDJPY COT and Liquidity AnalysisCOT Report Analysis:
Overal we can see strong bearish sentiment in the COT.
and price will most likely continue lower - in the longterm.
Because those short must be closed one day and it will be below the lows.
Also if Market makers wants to build longs they will be also doing it below the
lows. For new there is forming counter trend buy setup which I will probably take
but its not point of this sentiment analysis. This is bigger picture view and if Market
makers are bearish my longs countertrend trades will be taken with 1/2 risk than usually
/b]
Hey what up traders welcome to the COT data and Liquidity report. This is a big part of my FX Trading. Im always trying to trade with the Big players so knowing their positions is good thing.
Please be aware that institutions report data to the SEC on Tuesdays and data are reported on Fridays - so again we as retail traders have disadvantage, but there is possibility to read between the lines. Remember in the report is what they want you to see, that's why mostly price reverse on Wednesday after the report so their cards are hidden as long as possible. However if the trend is running you can read it and use for your advantage.
I created this simple free indicator which you can find in the my scripts. It's highlighting the day of the real report - Tuesday.
Here is the tip if the level has confluence with the high volume on COT it can be strong support / Resistance.
Analysis done on the Tradenation Charts
Disclosure: I am part of Trade Nation's Influencer program and receive a monthly fee for using their TradingView charts in my analysis.
"Adapt what is useful, reject what is useless, and add what is specifically your own."
— David Perk aka Dave FX Hunter ⚔️
USDJPY.1000.DUB trade ideas

USDJPY: Time to Recover?!The USDJPY chart formed an inverted cup & handle pattern that has broken its neckline on a daily timeframe, signaling a confirmed Change of Character (CHoCH) and suggesting a potential bullish reversal.
This could lead to a market recovery and a possible move towards the 146.00 level in the near future.

USDJPY Weekly CLS I Continuation setup I Target Weekly CLS HighHey, Market Warriors, here is another outlook on this instrument
If you’ve been following me, you already know every setup you see is built around a CLS range, a Key Level, Liquidity and a specific execution model.
If you haven't followed me yet, start now.
My trading system is completely mechanical — designed to remove emotions, opinions, and impulsive decisions. No messy diagonal lines. No random drawings. Just clarity, structure, and execution.
🧩 What is CLS?
CLS is real smart money — the combined power of major investment banks and central banks moving over 6.5 trillion dollars a day. Understanding their operations is key to markets.
✅ Understanding the behaviour of CLS allows you to position yourself with the giants during the market manipulations — leading to buying lows and selling highs - cleaner entries, clearer exits, and consistent profits.
🛡️ Models 1 and 2:
From my posts, you can learn two core execution models.
They are the backbone of how I trade and how my students are trained.
📍 Model 1
is right after the manipulation of the CLS candle when CIOD occurs, and we are targeting 50% of the CLS range. H4 CLS ranges supported by HTF go straight to the opposing range.
📍 Model 2
occurs in the specific market sequence when CLS smart money needs to re-accumulate more positions, and we are looking to find a key level around 61.8 fib retracement and target the opposing side of the range.
👍 Hit like if you find this analysis helpful, and don't hesitate to comment with your opinions, charts or any questions.
⚔️ Listen Carefully:
Analysis is not trading. Right now, this platform is full of gurus" trying to sell you dreams based on analysis with arrows while they don't even have the skill to trade themselves.
If you’re ever thinking about buying a Trading Course or Signals from anyone. Always demand a verified track record. It takes less than five minutes to connect 3rd third-party verification tool and link to the widget to his signature.
"Adapt what is useful, reject what is useless, and add what is specifically your own."
— David Perk aka Dave FX Hunter ⚔️

USDJPY: 300+ Pips From Previous Idea, What Hold Next? Hey Everyone
USDJPY is on a roll! It’s rebounded a whopping 300+ pips and is now on the positive side. We reckon it’s going to keep climbing in the coming days as DXY is starting to regain its strength.
And here’s the cherry on top: there’s some exciting news coming up, including the NFP tomorrow. This could really boost the USDJPY to a new record high.
But remember, when trading, it’s crucial to manage your risk carefully.
Now, let’s talk about the potential for a significant market movement. We’ve spotted a chance for a substantial bullish swing that could reach around 2050 pips. We’ve also identified three potential targets, so you can choose the one that best fits your analysis.
The main driver behind this move is the reversal of the Japanese Yen (JPY) from a bullish trend to a bearish one. So, let’s be cautious and use precise risk management techniques during this period.
Good luck and happy trading! 😊
Oh, and if you’d like to help us out, here are a few things you can do:
- Like our ideas
- Comment on our ideas
- Share our ideas
Thanks a bunch for your support! 😊
Cheers,
The Setupsfx_ Team

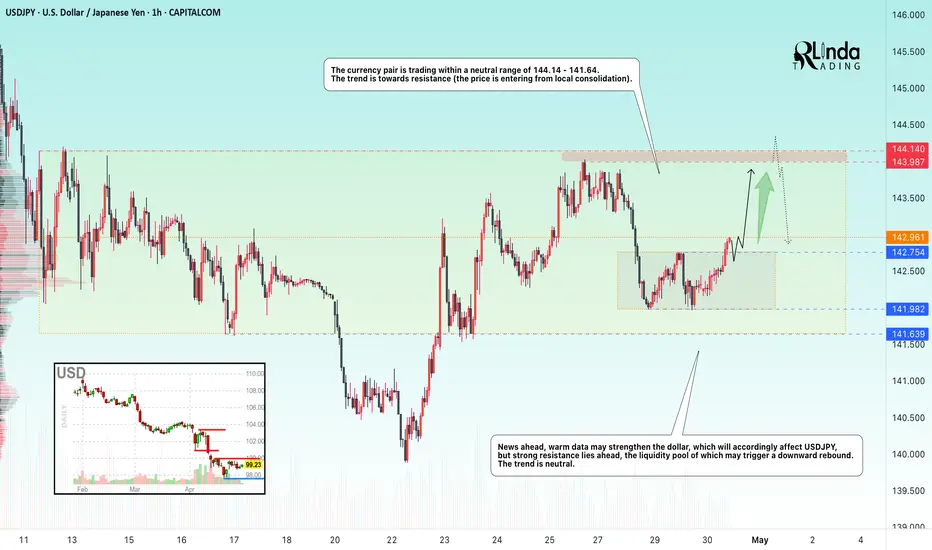
USDJPY → Price in range, retest of resistanceFX:USDJPY is emerging from local consolidation in hopes of seeing economic data that could support the dollar. The target for this movement could be the liquidity zone at 144.00.
The currency pair is trading within a neutral range of 144.14 - 141.64. However, a local consolidation has formed within the range, from which the price has broken out. The main task for the bulls is to hold the defense above 142.75, in which case we will be able to catch the price distribution to the upper border of the global range of 144.14.
News ahead, positive data may strengthen the dollar, which will accordingly affect USDJPY, but there is strong resistance at 144.14, whose liquidity pool may trigger a downward rebound. The trend is neutral.
Resistance levels: 143.9, 144.14
Support levels: 142.75, 141.98
There are no reasons to exit the global range. Over the past two weeks, this will be the first retest of the 144.14 zone, which in general only increases the chances of a false breakout and correction.
Best regards, R. Linda!
USDJPY: Bullish Continuation Confirmed?! 🇺🇸🇯🇵
USDJPY looks bullish after a test of a recently broken resistance.
The price formed a bullish imbalance candle on an hourly time frame
after its test and violated a resistance line of a bullish flag pattern then.
I believe that the pair will continue growing.
Goal - 145.8
❤️Please, support my work with like, thank you!❤️
I am part of Trade Nation's Influencer program and receive a monthly fee for using their TradingView charts in my analysis.

USDJPY COT and Liquidity AnalysisCOT Report Analysis:
You might thinking why Im bearish here when we can see such high number of shorts in the COT. Here is where historical extremes comes in to play. Look how JPY Longs (USDJPY shorts) reached 10 years extreme and in the same time there is 10 years extreme net positions. Right in the time may when Dollar is seasonally strongest. ITs time to take profits from these USDJPY shorts it will take price up.
Dollar Seasonal Tendencies
Hey what up traders welcome to the COT data and Liquidity report. This is a big part of my FX Trading. Im always trying to trade with the Big players so knowing their positions is good thing.
Please be aware that institutions report data to the SEC on Tuesdays and data are reported on Fridays - so again we as retail traders have disadvantage, but there is possibility to read between the lines. Remember in the report is what they want you to see, that's why mostly price reverse on Wednesday after the report so their cards are hidden as long as possible. However if the trend is running you can read it and use for your advantage.
I created this simple free indicator which you can find in the my scripts. It's highlighting the day of the real report - Tuesday.
Here is the tip if the level has confluence with the high volume on COT it can be strong support / Resistance.
Analysis done on the Tradenation Charts
Disclosure: I am part of Trade Nation's Influencer program and receive a monthly fee for using their TradingView charts in my analysis.
"Adapt what is useful, reject what is useless, and add what is specifically your own."
— David Perk aka Dave FX Hunter ⚔️

USDJPY Buy Opportunity Above 143.525Entry Point: 143.525 (unchanged)
Stop Loss: 141.847 (unchanged)
Target Point One (TP1): 145.063 (unchanged)
Final Target (TP2): Now refined to 147.883 instead of 147.894 — a small, precise update.
📈 Pattern and Structure:
Cup-and-handle formation still intact, indicating a continuation pattern.
Support confirmation at the 143.5 zone, showing a potential base for a bullish reversal.
The chart shows strong upside projection toward the resistance band near 147.8–148.0, highlighted with the upper purple zone.
📊 Risk-Reward Profile:
Risk (Entry to SL): 143.525 – 141.847 = 1.678
Reward (Entry to TP2): 147.883 – 143.525 = 4.358
Reward-to-Risk Ratio: 4.358 / 1.678 ≈ 2.6R — a favorable risk/reward setup.
🧠 Trade Notes:
Entry is slightly above a demand zone.
First target is conservative, near a known resistance.
Final target aligns with prior highs and the broader ascending wedge’s upper bound.
Timing suggests the bullish push may unfold over the next few sessions (likely May 6–8 range, as curved arrow indicates a rounded retest/bounce scenario)

USD/JPY) Bullish trand analysis Read The ChaptianSMC Trading point update
Technical analysis of USD/JPY on the 2-hour timeframe, and it presents a bullish continuation setup. Here's a breakdown of the key elements and the idea behind the analysis:
---
1. Ascending Channel Formation
The price is trading within an ascending channel, suggesting a controlled uptrend.
Higher highs and higher lows confirm the trend structure.
2. Key Support and Fair Value Gap (FVG)
There’s a well-identified support level where price has bounced before (highlighted in yellow).
A Fair Value Gap (FVG) zone is marked slightly above the support level, which could act as a short-term demand area.
Price is currently pulling back into this zone, potentially setting up a buying opportunity.
3. EMA 200 Support
The 200 EMA (~143.78) is acting as dynamic support just below the current price.
If price drops further, this level may offer strong technical support.
4. RSI Momentum
RSI is above 50 (currently 56.37), supporting the bullish trend and showing room for continued upside.
5. Target Point
The chart anticipates a bounce off the support/FVG zone and a rally toward the upper boundary of the channel, targeting 147.153.
Mr SMC Trading point
---
Summary of the Idea:
This is a bullish continuation setup within an uptrend channel. The analyst expects a potential long entry around the FVG/support zone, with a target at the channel top (147.15). Confluence from the EMA 200, RSI, and previous structure supports this bullish bias.
Pales support boost 🚀 analysis follow)

USD/JPY 4H Analysis: Demand Zone Re-Test Before Bullish Continua1. Trend Channel
🔼 Uptrend: The pair is moving inside an ascending channel.
▪️ Support: Lower boundary of the channel.
▪️ Resistance: Upper boundary of the channel.
2. Recent Price Action
🔴 Pullback: After reaching the top at 146.199, price is retracing.
📉 Price is now heading toward the Demand Zone.
3. Demand Zone
🟦 Demand Zone (142.405 – 143.180):
This zone could act as a strong support
Buyers might step in here
Watch for bullish patterns or rejections around this area
4. EMA 70
📏 EMA 70 (143.568) is slightly below current price (143.949) — this may offer temporary support/resistance.
5. Target
🎯 Target Point: 146.194
If price bounces from demand zone, this is the next bullish target.
Possible Scenario
1. 🔽 Price dips into the Demand Zone
2. 🟢 Bullish bounce → Confirm with candlestick signals
3. 🚀 Upside move targeting 146.194

USDJPY Weekly CLS I Model 2 I Target CLS HighHey, Market Warriors, here is another outlook on this instrument
If you’ve been following me, you already know every setup you see is built around a CLS range, a Key Level, Liquidity and a specific execution model.
If you haven't followed me yet, start now.
My trading system is completely mechanical — designed to remove emotions, opinions, and impulsive decisions. No messy diagonal lines. No random drawings. Just clarity, structure, and execution.
🧩 What is CLS?
CLS is real smart money — the combined power of major investment banks and central banks moving over 6.5 trillion dollars a day. Understanding their operations is key to markets.
✅ Understanding the behaviour of CLS allows you to position yourself with the giants during the market manipulations — leading to buying lows and selling highs - cleaner entries, clearer exits, and consistent profits.
🛡️ Models 1 and 2:
From my posts, you can learn two core execution models.
They are the backbone of how I trade and how my students are trained.
📍 Model 1
is right after the manipulation of the CLS candle when CIOD occurs, and we are targeting 50% of the CLS range. H4 CLS ranges supported by HTF go straight to the opposing range.
📍 Model 2
occurs in the specific market sequence when CLS smart money needs to re-accumulate more positions, and we are looking to find a key level around 61.8 fib retracement and target the opposing side of the range.
👍 Hit like if you find this analysis helpful, and don't hesitate to comment with your opinions, charts or any questions.
⚔️ Listen Carefully:
Analysis is not trading. Right now, this platform is full of gurus" trying to sell you dreams based on analysis with arrows while they don't even have the skill to trade themselves.
If you’re ever thinking about buying a Trading Course or Signals from anyone. Always demand a verified track record. It takes less than five minutes to connect 3rd third-party verification tool and link to the widget to his signature.
"Adapt what is useful, reject what is useless, and add what is specifically your own."
— David Perk aka Dave FX Hunter ⚔️

usdjpyi will love to hold on to buy bias, but i want to see price react to the demand level and look for buy confirmation on lower tf

USDJPY - Long Done, Soon Short!Hello TradingView Family / Fellow Traders. This is Richard, also known as theSignalyst.
📈As per our last USDJPY analysis, it rejected the orange support zone and has been trading higher.
What's next? As USDJPY approaches the upper blue trendline, we will be looking for shorts.
🏹 The highlighted red circle is a strong area to look for sell setups as it is the intersection of the upper blue trendline and green supply zone.
📚 As per my trading style:
As #USDJPY retests the red circle zone, I will be looking for bearish reversal setups (like a double top pattern, trendline break , and so on...)
Meanwhile, USDJPY would remain bullish medium-term and a bullish continuation towards the red circle is expected.
📚 Always follow your trading plan regarding entry, risk management, and trade management.
Good luck!
All Strategies Are Good; If Managed Properly!
~Rich
Disclosure: I am part of Trade Nation's Influencer program and receive a monthly fee for using their TradingView charts in my analysis.

USD/JPY For Bullishwait for pull-back near by entry point and then go long
general trend is up trend
have fun :)

Bearish reversal?USD/JPY is rising towards the pivot which has been identified as an overlap resistance and could reverse to the 1st support which is a pullback support.
Pivot: 146.90
1st Support: 142.06
1st Resistance: 150.92
Risk Warning:
Trading Forex and CFDs carries a high level of risk to your capital and you should only trade with money you can afford to lose. Trading Forex and CFDs may not be suitable for all investors, so please ensure that you fully understand the risks involved and seek independent advice if necessary.
Disclaimer:
The above opinions given constitute general market commentary, and do not constitute the opinion or advice of IC Markets or any form of personal or investment advice.
Any opinions, news, research, analyses, prices, other information, or links to third-party sites contained on this website are provided on an "as-is" basis, are intended only to be informative, is not an advice nor a recommendation, nor research, or a record of our trading prices, or an offer of, or solicitation for a transaction in any financial instrument and thus should not be treated as such. The information provided does not involve any specific investment objectives, financial situation and needs of any specific person who may receive it. Please be aware, that past performance is not a reliable indicator of future performance and/or results. Past Performance or Forward-looking scenarios based upon the reasonable beliefs of the third-party provider are not a guarantee of future performance. Actual results may differ materially from those anticipated in forward-looking or past performance statements. IC Markets makes no representation or warranty and assumes no liability as to the accuracy or completeness of the information provided, nor any loss arising from any investment based on a recommendation, forecast or any information supplied by any third-party.

USD/JPY Eyes Breakout After Healthy Wave 4 CorrectionThe USD/JPY pair is currently unfolding a clean impulsive 5-wave structure to the upside. The price action has already completed Waves 1, 2, and 3, and has entered a probable Wave 4 correction.
Wave 3 appears extended and tapped into a key Fair Value Gap (FVG), which acted as resistance.
Wave 4 is likely to develop as a shallow retracement, possibly forming a bull flag or expanded flat before launching into Wave 5.
The ascending channel supports the bullish structure with both Wave 2 and Wave 4 respecting lower bounds.
Targets: 144.750 - 144.351
Stoploss: 146.268

NNFX USDJPY Short ContinuationEntered 1% Position on USDJPY Short
Settings:
50% Scale Out at 1xTP
USD News Friday NFP secure position.
Commentary:
First trade back after a break due to burn out. Excited to be back in the markets trading Judge Fortress Algorithm signals. Double excited to begin a new chapter sharing this trade setup journal with the public and build on NNFX Advanced Tactics for Live Trading!


USDJPY Will Move Higher! Long!
Take a look at our analysis for USDJPY.
Time Frame: 12h
Current Trend: Bullish
Sentiment: Oversold (based on 7-period RSI)
Forecast: Bullish
The market is on a crucial zone of demand 144.942.
The oversold market condition in a combination with key structure gives us a relatively strong bullish signal with goal 148.284 level.
P.S
We determine oversold/overbought condition with RSI indicator.
When it drops below 30 - the market is considered to be oversold.
When it bounces above 70 - the market is considered to be overbought.
Disclosure: I am part of Trade Nation's Influencer program and receive a monthly fee for using their TradingView charts in my analysis.
Like and subscribe and comment my ideas if you enjoy them!

USDJPY NEXT MOVE Assumption of a Bullish Continuation (Without Confirmation)
• Disruption: The projected upward path to the “Double Top Resistance” presumes a bullish continuation without confirming signals (e.g., bullish candlestick patterns, volume spikes, or RSI divergence).
• Alternative View: Price is currently rejecting the resistance zone and heading downward—this could be the start of a deeper retracement or trend reversal, not just a dip.
⸻
2. “Strong Support” Zone is Based on a Single Bounce
• Disruption: The “Strong Support” zone is derived from a single historical reaction. It might not hold on the next test, especially if momentum and volume increase on the way down.
• Counterpoint: Stronger support typically comes from multiple prior reactions or a broader consolidation zone.
⸻
3. Lack of Consideration for Bearish Structure
• Disruption: The broader structure is bearish (from left to right on the chart), with lower highs and lower lows. The analysis skips over this longer-term downtrend context.
• Alternative: Instead of anticipating a return to 148, traders might watch for short setups if price fails to break back above the resistance cleanly.
⸻
4. Volume Decline During the Recent Rally
• Disruption: The bullish leg into early May shows diminishing volume. This divergence between price increase and falling volume weakens the bullish case.
• Warning Sign: Could indicate a bull trap, followed by a sharper fall through the support.
⸻
5. Overemphasis on “Double Top” without Neckline Break
• Disruption: The projected double top at ~148 assumes that level will be revisited. But without a confirmed breakout through 144.000, it’s premature to predict such a move.
• Risk: Traders buying now on this expectation may be caught in a pullback that dips below the “Strong Support.”

MAJOR SUPPORT BUYMajor support zone holding strong. From weekly down to 1H, all signals align for a buy. Structure supports bullish continuation—watch closely.

USDJPY Tuesday AMThe overall weekly direction is quite bearish as there has been a recent bullish days retracement. If by 9:30 AM Eastern standard time we see this pair break internal liquidity by the time the market opens then we can expect this pair to go for more shorts. But given the timing of the week with the news, I’m expecting this pair to build momentum to take buyside liquidity before stamping through lower price. I expect to see this pair range a bit until Wednesday’s news.

