USDJPY:Sharing of the Latest Trading StrategyAll the trading signals today have resulted in profits!!! Check it!!!👉👉👉
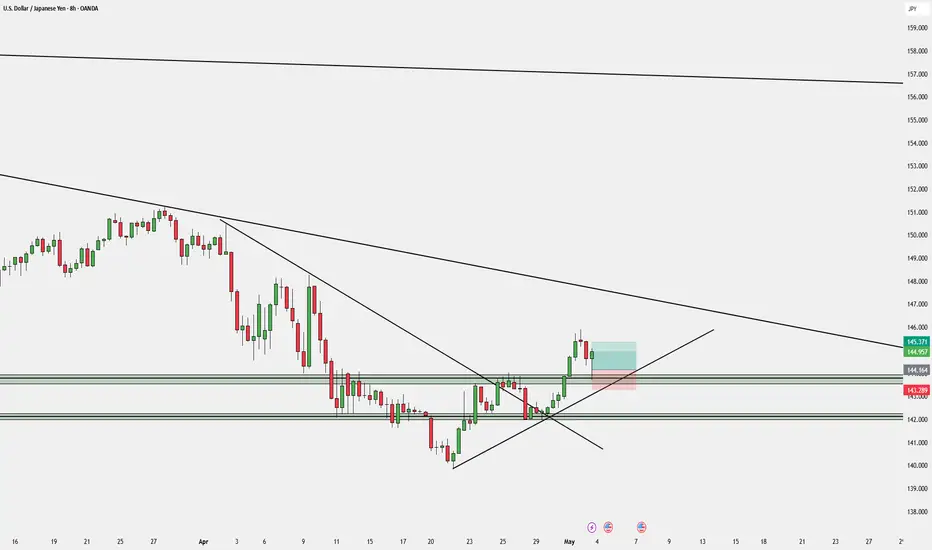
Technically speaking, the USD/JPY has been blocked by the 200-period SMA on the 4-hour chart for three consecutive trading days. The RSI has broken below the neutral level of 50, indicating that the bears are in the dominant position. Fundamentally, the global geopolitical risks have escalated, leading to the inflow of safe-haven funds into the Japanese yen. Moreover, the Bank of Japan maintains a dovish stance, while the policy direction of the Federal Reserve is unclear. The FOMC meeting will be held this week. In terms of trading operations, one can lightly open a short position near 143.50.
Trading Strategy:
sell@144.500-143.5000
TP:142.5000-141.7500
The signals in the Signature have brought about continuous profits, and accurate signals are shared every day. Hurry up and click to get them!
👇 👇 👇 Obtain signals👉👉👉
USDJPY.1000.DUB trade ideas

Weakening green back I seetherefore I have sold one lot of USDJPY with stop loss somewhere between 144-145

its just workingfor record only.
IDm and bos.
USDJPY on the 1H chart shows bearish structure with multiple BOS (Break of Structure) and CHoCH (Change of Character) confirmations. Price rejected from supply zones (OBs) and is heading lower after a recent CHoCH. Momentum favors sellers unless a bullish BOS forms above 144.300.

Fundamental Market Analysis for May 6, 2025 USDJPYUSDJPY:
The Japanese Yen (JPY) declined against its US counterpart during Tuesday's Asian session, albeit without any follow-through selling. Despite the Bank of Japan's (BoJ) ‘restrained’ guidance last Thursday, Japan's rising inflation and prospects for continued wage increases leave the door open for further policy tightening by the central bank. In addition, uncertainty over US President Donald Trump's trade policy and rising geopolitical tensions continue to act as tailwinds for the safe-haven yen.
Meanwhile, the prospect of more aggressive rate cuts by the Federal Reserve (Fed) is not helping the US Dollar (USD) attract meaningful buyers and is helping to limit the upside for the USD/JPY pair. Traders also seem unwilling to wait for more signals on the Fed's policy outlook before positioning for the next leg of directional movement. Thus, the main focus will be on the outcome of the two-day FOMC meeting, which starts this Tuesday and which will give the dollar a fresh impetus.
Trading recommendation: BUY 143.90, SL 143.60, TP144.80

USDJPY: Detail Technical Analysis and USDJPY CharacteristicsIn this long video, I go through USD/JPY short idea in 2 parts:
Part 1: Detailed Technical Analysis and Elliott Waves
1. Head and shoulders - daily
2. Completion of Elliott Waves
3. Breaking down of A-B-C
4. Measurement rules on profit targets.
Part 2: USDJPY as a product (characteristics)
1. It's a flight-to-safety product similar to Gold
2. thus also a short equity markets product.
2. It is a short dollar product.

USDJPY: Continue to increase in the uptrend channel!USD/JPY's next hurdle is 142.60-142.65. A break above could trigger short-covering, pushing the pair to 143.00, then 143.40-143.45. Sustained buying above 144.00 would confirm a near-term bottom and open the door for a significant rally.

USDJPY:Sharing of the Latest Trading StrategyThis week’s trading wrapped up successfully. Our exclusive VIP trading signals achieved a 90% accuracy rate!👉👉👉
This week, the exchange rate of the US dollar against the Japanese yen was quoted at 144.9180, declining compared to the previous trading day. Technically, pay attention to the resistance near 145.9240 at the upper side and the support near 143.7250 at the lower side. One can consider placing small short positions near the resistance level. At the same time, keep an eye on the impact of economic data of the US and Japan as well as the policies of their central banks on the exchange rate.
Trading Strategy:
sell@145.900-145.7000
TP:144.7500-143.7500
The signals in the Signature have brought about continuous profits, and accurate signals are shared every day. Hurry up and click to get them!
👇 👇 👇 Obtain signals👉👉👉

USDJPYUSDJPY bull still on the market nice rejection at 143.864 currently still waiting for the push to 146.000 after this break we can look to the zone around 147.500/148.000 pretty simple.

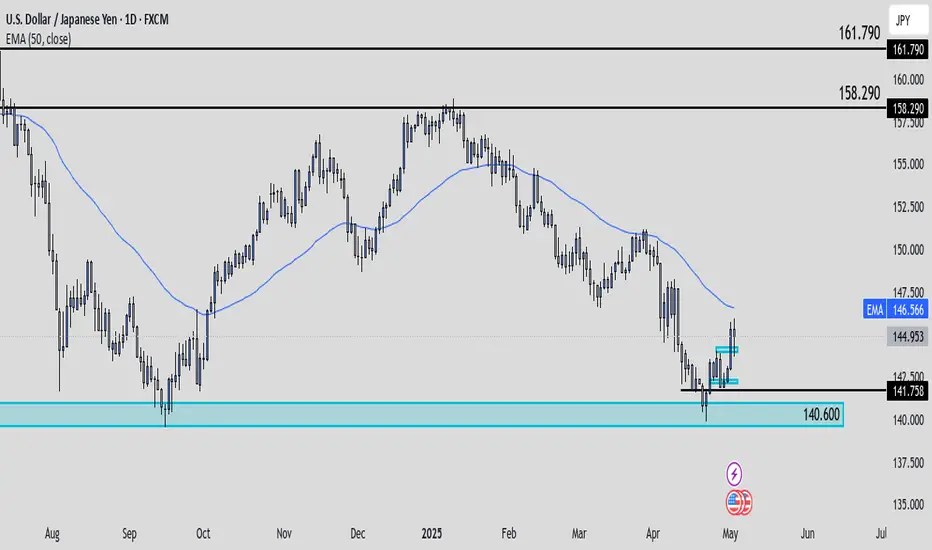
UsdJpy Trade IdeaLast week UJ ended up tapping back into a major support level at 140.600 where we then seen a change of direction with smaller time frames supporting the new bullish direction. For the new week longs should be coming into play so I'll personally be getting into buys for this pair.
Be careful with buying USDJPY!!!Hello traders this is a trade that almost everyone sees it coming but it is too good to be true.
We have a clear breakout of this downtrend.
An inverted head and shoulders some might say cup and handle.
A lot of ppl (including me) are going to put their SL inside this zone but that can be dangerous I recommend taking a better entry or just leaving this trade bcz it is too risky. Do not be a victim of FOMO.
Lets wait for the bounce first then we will secure our position that is all I am saying and do not simply enter after the trendline touches the trendline because this might be a very strong downtrend.

usdjpy shortUSDJPY has been showing calculated signs of bearish intent — but not the kind of drop beginners should rush into.
Here’s what I’m seeing :
On the 1H timeframe, an M-structure formed between Thursday and Friday, triggering early bearish sentiment.
However, zooming out to the 4H, just above this M lies a clean liquidity pool (resting buy stops) and a Bearish Order Block (OB) — right at the origin of the last aggressive move down.
This OB sits directly above the previous week range, and interestingly, it’s also the exact candle that broke the range structure.
This tells me something powerful:
The M on the 1H was likely a trap, luring in early sellers before the market grabs liquidity and delivers a true mitigation into the 4H OB.
So what am I expecting?
Early week manipulation (Monday–Tuesday) :
Price may break above Friday’s high, sweeping liquidity and filling inefficiencies.
Mitigation into the 4H OB :
If price taps this zone and rejects with momentum (watch for bearish engulfing, M structure, or FVG on 15min/1H), I’ll prepare for a calculated short setup.
Potential mid-to-late week sell-off :
If confluence aligns post-OB rejection, expect price to target previous internal lows or the base of the previous week range.
⚠️ Risk Note — Read Carefully :
This is not financial advice.
Although my bias is bearish based on multi-timeframe confluence, news flow, liquidity behavior, and smart money concepts, every trader should conduct their own analysis before entering a position.
Don’t get trapped by early M-patterns.
Be patient. Let the market show its hand, then respond — not react.
Trade smart. Protect capital. Master patience.

USDJPY⚡️After the trendline break and retest
⚡️ Expecting market to rally up to the next point of interest.
Feel free to tell me what you think in the comment section.

USDJPY⚡️After the trendline break and retest
⚡️ Expecting market to rally up to the next point of interest.
Feel free to tell me what you think in the comment section.

USDJPY - ShortHi team ,
For WK19 we have this USDJPY short
Patience is the key guys , nobody will give you 100% a month remember earning just 1% a month beats 99% of retail community
Thank you !

UJ trade ideamy trendline wave strategy, more of aa counter trend trade with the overall bearish flow. im trying to capitalize on a need for price to push up.
UJ target buyUJ my target buy because price reat patten Reversal buy at Fibo TP2.and price gave 2 point entry for a 50% fibo.. next target The TP 2..

144.50 is a crucial turning pointAccording to the data from the LMAX Exchange, the volume of short yen positions being closed out in leveraged accounts has increased for three consecutive days. However, commercial accounts are still placing hedging buy orders above 145.50, forming a seesaw battle pattern between the bulls and the bears.

USDJPY LONGUSDJPY was oversold on the higher timeframe and rejected a weekly support level around 140.07. Daily resistance turn support around 143.95. Break of structure at resistance. Looking to go long on pullback to daily support around 144.00.

I think USDJPY is at the beginning of wave 3I think USDJPY is at the beginning of wave 3. If it maintains the channel and breaks the downtrend line of wave ABC

USDJPY: FVG Then Bullish Overflow?It has been a significant week for USD/JPY. Following a break of structure (BOS) on the 4-hour timeframe, price moved away from equilibrium, leaving behind a Fair Value Gap (FVG). As the new week begins, we may observe a false move designed to induce traders into premature short positions before a potential bullish reversal—or vice versa. Additionally, given the recent BOS, price may temporarily stall to facilitate order accumulation. Next week will be pivotal in determining the pair’s next direction.
Watch out for the key levels

USDJPY Technical Expert Review - 3 May 2025🔮 USDJPY Price Forecast – 1H Timeframe
📈 Bullish Scenario:
Price may bounce from the LPP Inducement + HL (Higher Low) area and push upward.
The first target would be the upper blue LQ Close zone, which is still untouched.
If we observe weakness or an “M-shaped” reaction within that blue zone, a sell setup could be valid (inducement trap).
However, if price breaks and closes above the blue zone, further bullish continuation is expected — possibly toward the higher green liquidity zone around 147+.
📉 Bearish Scenario:
If the HL (blue zone) fails and breaks down, forming a new Lower Low (LL),
Then we can expect price to retrace toward the lower green demand zone, around 141.000, which aligns with higher timeframe liquidity and unmitigated demand.


USD/JPY Bull is back to push the price upHi All,
Firstly, I want to congrats to traders who short the market for the last few months. Well done!!!
Those who is waiting for LONG opportunity, let's get ready for sniper entry.
Here is my prediction and entry on USD/JPY. As you can see, the orange zone around $139-$140 is extremely strong zone. Prices reverse 3 times on this level. On 22 March 2025, the closed daily candle was formed a hammer candle and followed by a strong bullish candle next day which indicates potential reversal to upward.
The RSI indicator lines were crossed on 22 March 2025. Now, the indicator is showing upward momentum as the both lines are about cross 50%.
We also have bullish divergence on the volume indicator. As you can see, the volume was going to sideway where as the price was heading to the orange zone.
These confluence is supporting me to enter LONG. Therefore, I entered 3 entry at different price point which is $143.50, $142.996, $144.70.
