USDJPY is Sellinghaving given a CHoCH, it is temporally retracing to the up side to take out liquidity before giving us an official downtrend on the 1hour time frame. sell 1 and sell 2 are the two possible areas it could touch prior to the expected movement. stop loss should be 50 pips above sell 2 and also manage your risk.
USDJPY.1000.DUB trade ideas

USD/JPYThe pattern has **four points**: A, B, C, and D, forming two legs: **AB and CD**, which are equal in length and time.
There are two types:
* **Bullish AB=CD**: Signals a potential reversal to the upside.
* **Bearish AB=CD**: Signals a potential reversal to the downside.
Fibonacci Guidelines:
* The length of AB should be approximately equal to CD.
* The time it takes for price to move from A to B should be similar to C to D.
* The retracement BC is often:
* 61.8% or 78.6% of AB
* The projection CD is:
* 127.2% or 161.8% of BC

USD/JPY(20250502)Today's AnalysisToday's buying and selling boundaries:
144.67
Support and resistance levels:
147.49
146.44
145.75
143.58
142.90
141.84
Trading strategy:
If the price breaks through 145.75, consider buying, the first target price is 146.44
If the price breaks through 144.67, consider selling, the first target price is 143.58
USDJPYThe technical analysis shows a bullish outlook for the USDJPY pair on the 4-hour timeframe, summarized as follows: The price was within a descending channel and broke upwards. After the breakout, a strong bullish impulse occurred. The price broke a previous structural level (price structure) and is currently retreating to form a pullback.

USDJPY .. LONGOANDA:USDJPY
Price is nearing a critical level around .
No setup, no trade. For me, a solid plan always comes before any prediction.
****If the zone is broken and confirmed with a retest, I’ll adjust my plan accordingly for a possible reverse trade.
USDJPY Sell Setup Idea✅ Technical Basis:
Bearish divergence spotted on RSI (price making higher high while RSI making lower high).
Double top pattern formed at resistance zone.
Resistance is holding firm, signaling potential downside.

LOOKING FOR USDJPY TO TARGET 149.400 Looking for a retrace into 143.9 and then a move to 149.400 weekly and monthly supply .

USDJPY 01.05.2025~+ The sentiment is turning around - tariffs de-escalation talks, trade deals with major trading partners
+ COT
+ BOJ Bearish forward guidance
~+ US ec. news failure - USD shortly dipped on bearish Jobless Claims but quickly recovered and shot up on ISM PMI Mfg
~- USDJPY seasonals

USDJPY 30M CHART PATTERNThis chart illustrates a bullish trade setup for USD/JPY on the 30-minute timeframe. Here's a quick breakdown:
Pattern: The price appears to be forming higher lows and higher highs, suggesting an uptrend.
Green Arrows: Indicate points of price support and potential entry zones.
Orange Circles: Highlight pullbacks or corrections within the trend.
Green Trendline: Shows an ascending support line, supporting the bullish outlook.
Entry Point: Around the current price near 145.260, aligned with trendline support.
Stop Loss: Set just below the recent support zone (~144.134) to limit downside risk.
Take Profit: Targeting the upper green box near 147.493, aligned with previous highs.
This setup seems to be a buy-the-dip strategy in an uptrend.
Do you want help analyzing the risk-reward ratio or confirmation signals?

USD/JPY... BUY!!! RETEST ON STRONG BUY AREA Shown multiple times in the past months this area show and still holds as support for USD/JPY.
BUY IN $145-$148. Target price $155-$160+ THIS IS A ALL MONTH HOLD OR UNTIL TARGET PRICE IS REACHED! FOLLOW ME FOR MORE THX AND ENJOY.


USDJPY... 4H chat partternThe 140.166 level on USD/JPY appears to be a historical support level. If price action previously bounced around this area, traders might be watching it as a key zone where buying interest could re-emerge.
To evaluate this level properly, consider:
1. *Past price reactions*: Did price previously reverse or consolidate around 140.166?
2. *Volume profile*: High volume near this level might strengthen its significance.
3. *Indicators*: Are RSI, MACD, or moving averages signaling oversold or potential reversal near this level?
4. *Fundamentals*: Watch for Bank of Japan and Fed policy signals or geopolitical developments, as they heavily influence USD/JPY.

Fundamental Market Analysis for March 01, 2025 USDJPYThe USD/JPY pair is trading with small losses, hovering around the mid-143.00s after disappointing US economic growth data and weak Japanese economic reports caused a divergence in sentiment between the two currencies. The US economy contracted 0.3 per cent in the first quarter of 2025, the first contraction since 2022, missing growth expectations and highlighting the impact of rising imports and government spending cuts. At the same time, Japan released weaker-than-expected industrial production and retail sales data, limiting the yen's gains even as global risk appetite declined.
On the macroeconomic front, the US Bureau of Economic Analysis reported that real GDP contracted 0.3% in Q1, missing the market forecast for a 0.4% increase and slowing sharply from the 2.4% growth in Q4 2024. The contraction was primarily driven by a 41 per cent rise in imports and lower government spending. Meanwhile, core PCE inflation, the Fed's preferred measure of inflation, fell to 2.3 per cent year-on-year, in line with expectations and below February's 2.5 per cent. Other data showed a slowdown in job creation, with the ADP report showing just 62,000 new jobs in April against expectations of 108,000.
Despite the softer data, personal spending remained flat in March, rising 0.7%, while incomes rose 0.5%. However, market sentiment turned cautious, with the Dow Jones Industrial Average falling more than 200 points to stagnate around 40,300.
In Japan, the yen weakened 0.5% against the dollar as industrial production and retail sales data disappointed, highlighting the fragility of the domestic economy.
Trade recommendation: BUY 144.20, SL 144.00, TP 145.00

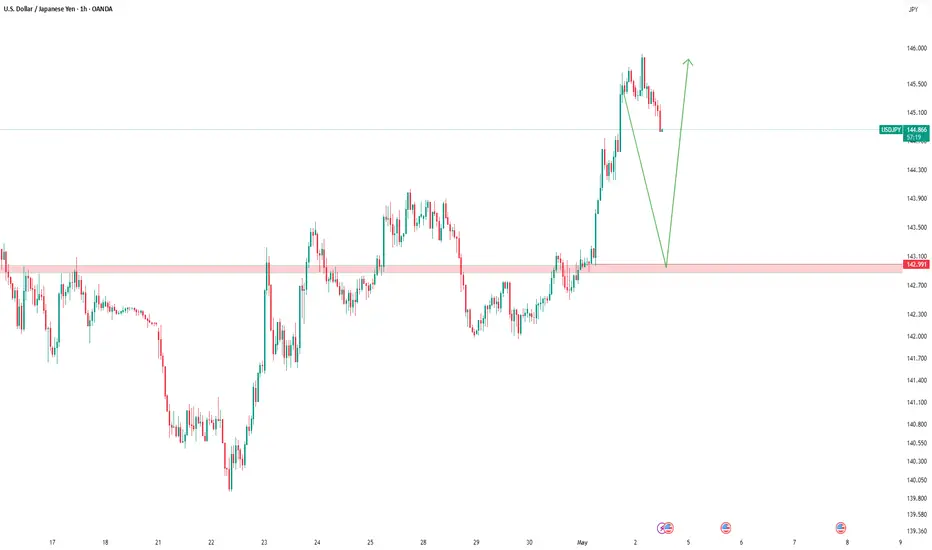
Zone to zone The market broke out our weekly zone ,I'm predicting that it will go up to the next nearest zone . Currencies moves slowly this move might even take days, but I advise that once you hit your target close your trades or move your stop loss to protect your profits .
Remember this is not a financial advice but this is a suggestion of mine

USDJPY – Potential Volatility AheadUSDJPY started the week with a 1.3% fall on Monday, where it fell from opening levels around its weekly highs at 143.88, to a low at 141.92 and has since stayed relatively quiet. However, that could all change as we move through towards Friday, as FX markets move into a 3-day period packed with important scheduled events.
Risk sentiment towards US assets, and USDJPY in particularly, could be impacted by todays preliminary US Q1 GDP release at 1330 BST, which could indicate whether the US economy experienced a bigger slowdown at the start of 2025 than initially anticipated.
Then, later in the day the Fed’s preferred gauge of inflation, the PCE Index is released at 1500 BST, and this is followed by the earnings updates from US technology giants Microsoft and Meta later in the evening.
If that wasn’t enough to potentially increase USDJPY volatility, the Bank of Japan (BoJ) will post its interest rate decision early on Thursday morning. Although no change is expected due to the current uncertain tariff impacted climate and on-going trade deal negotiations with the US, the press conference led by BoJ Governor Ueda could contain some market moving commentary.
This all culminates on Friday’s US Non-farm Payrolls update at 1330 BST, where all eyes may well be focused on the unemployment rate print, currently 4.2%, to see if the US labour market is weakening, which if it is, could open the possibility of Fed rate cuts.
Technical Update: 144.06 Resistance Holds Latest Recovery
Having approached 139.58, the September 16th 2024 low trade, USDJPY has seen a recovery in price. However it could be argued, this appears a reaction to what were likely over-extended downside conditions, in place after the 7.50% decline from 151.21, the March 28th 2025 high.
Importantly, latest price strength has been held and so far, reversed by 144.06, the 38.2% Fibonacci retracement of March 28th to April 22nd weakness, which traders are likely to continue to focus on, as a potential resistance.
The BoJ announcement and data releases this week have potential to be important sentiment drivers for USDJPY, and we must be aware of support and resistance levels that may help us gauge the next direction of future price moves.
Resistance Levels:
As we have said, so far, recent recovery themes have been unable to break above 144.06 retracement resistance, which will likely be an area that needs to give way on a closing basis to suggest possibilities of a more extended phase of price strength.
While much will depend on the market’s reaction to up and coming events and future price trends, 144.06 closing breaks might suggest scope towards 145.43 the higher 50% Fibonacci level, even 146.80, the 62% retracement.
Support Levels:
Having seen Monday’s decline, price activity is back to what might be a support focus for traders at 142.00, equal to half recent strength.
Closing breaks of 142.00 may be an indication of potential for further declines, although it is possible the 139.58 September 16th 2024 low may need to give way on a closing basis to suggest possibilities of increasing downside pressure on price.
The material provided here has not been prepared in accordance with legal requirements designed to promote the independence of investment research and as such is considered to be a marketing communication. Whilst it is not subject to any prohibition on dealing ahead of the dissemination of investment research, we will not seek to take any advantage before providing it to our clients.
Pepperstone doesn’t represent that the material provided here is accurate, current or complete, and therefore shouldn’t be relied upon as such. The information, whether from a third party or not, isn’t to be considered as a recommendation; or an offer to buy or sell; or the solicitation of an offer to buy or sell any security, financial product or instrument; or to participate in any particular trading strategy. It does not take into account readers’ financial situation or investment objectives. We advise any readers of this content to seek their own advice. Without the approval of Pepperstone, reproduction or redistribution of this information isn’t permitted.

USDJPY 30M CHART PATTERNThis chart represents a USD/JPY (U.S. Dollar / Japanese Yen) 30-minute trading setup. Here's a breakdown of what's shown:
Downtrend: Price drops sharply from around 143.95 to a support zone just above 141.80.
Double Bottom Pattern: Two lows are marked with orange circles, suggesting a potential reversal.
Entry Point: Marked by a green arrow where price bounces off the support zone.
Take Profit Zones:
First Take Profit: Around 143.25, near previous resistance.
Final Take Profit: Around 143.95, retesting the previous high.
Stop Loss: Positioned below the support zone (~141.70), minimizing risk if the setup fails.
This is a classic reversal setup using a double bottom pattern, targeting previous resistance levels.
Are you considering trading this setup or analyzing it for learning purposes?

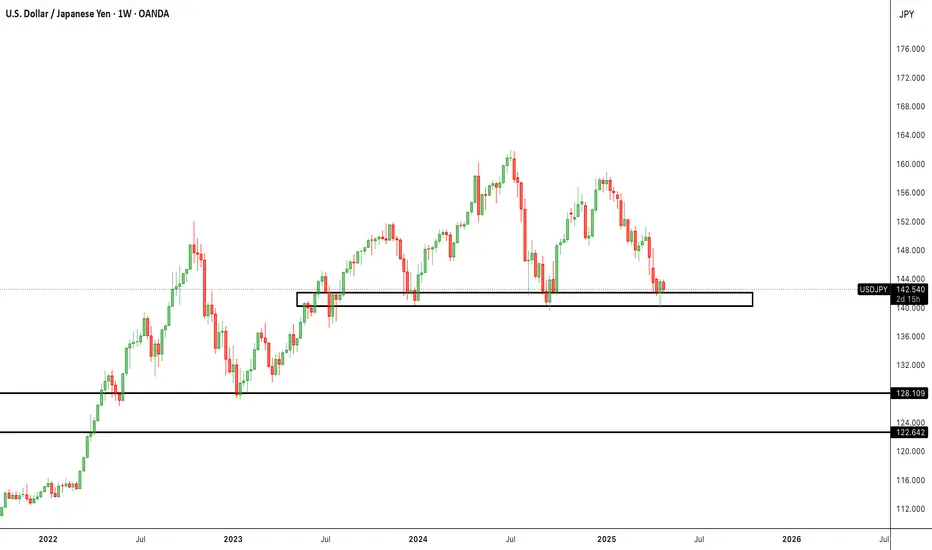
USD/JPY Retests Support Zone as Kato-Bessent FX Talks UnfoldOverview Summary:
USD/JPY has reached a structurally significant weekly support/demand zone (140.0–142.0), where price has historically found support and initiated bullish reversals. As price consolidates in this zone, we are also seeing critical macroeconomic shifts unfold, mainly surrounding 'Japan-U.S. FX policy negotiations' and diverging central bank strategies.
Key Macroeconomic Drivers:
1. BOJ Policy Outlook:
The Bank of Japan has held rates near zero while inflation creeps above target. Despite global tightening trends, BOJ remains dovish and is cautious about hiking too soon. This supports further JPY weakness unless a shift occurs.
2. Kato-Bessent FX Meeting:
Japan and the U.S. held their first bilateral currency discussion in 2025, with Kato emphasizing Japan’s economic conditions and wage data. While the U.S. issued no formal statement, the absence of joint commentary adds uncertainty around potential FX alignment or future intervention strategies.
3. U.S. Treasury Talks with Japan:
U.S. and Japan are back at the negotiation table regarding FX stability and trade policy. While both affirm free-market rate setting, growing U.S. trade deficits with Japan are pressuring the Yen higher and inviting political attention.
4. U.S. Trade Pressures & Currency Realignments:
With the U.S. trade deficit with Japan widening and USD strength persisting, policymakers face rising pressure to address competitiveness. If unchecked, this could trigger direct currency commentary or coordinated action in future meetings.
5. Global Currency Realignments:
With USD strength persisting on rate divergence and geopolitical flows, Japan’s export competitiveness may cause either policy changes or FX intervention if the Yen weakens too far.
Technical Analysis:
- Weekly chart shows a clear support/demand zone between 140.0–142.0 , previously acting as a reversal area multiple times since 2023.
- We’re currently seeing early signs of consolidation and wick rejection, a potential setup for a bullish bounce if macro factors align.
- Break below 140.0 opens downside to 128.00 and 122.00 , both historically significant zones.
Trade Setup (If Support Holds):
Entry Zone: 140.00–142.00
Target 1: 150.00
Target 2: 158.00
Invalid Setup: Daily Close Below 139.50
Final Take:
USD/JPY is currently at a macro + technical inflection point. If support holds and Japan refrains from policy tightening, we could see the pair bounce sharply back into the 147–150 range. However, any unexpected BOJ hawkishness or coordinated U.S.-Japan currency intervention would flip this narrative quickly. Stay tactical, monitor policy headlines, and size positions with volatility in mind.
USD/JPY Bullish ReversalUj has been bearish since March with bulls dominating the market for the past week and considering persisting bullish momentum, I will be looking long with my stop loss below Monday's low as I target the 147.972 daily resistance level. The overall trend is bearish, hence the need to remain conservative with our long positions till major structural levels are broken to give us added confluence for our bullish reversal.

USDJPY BuyingIt's Look Intresting For Buy, Make Sure Follow Risk Management I have my Plan, If You have any queries Message Me. Peace...

LONG POSITION SCALPING USD/JPY🔵 Technical Analysis for USD/JPY:
We are observing a key rebound support area at the current levels.
Entry Zone: Around 142.48
Rationale for the Trade:
Price is positioned at a strong order block area on the 1-hour timeframe.
Expecting a bullish corrective move from the current support zone.
First Target for the Correction: Aiming for the 144.00 level as an initial resistance and profit-taking area.
Stop-Loss Level: A break and close below 141.44 would invalidate the setup.
Note: Proper risk management is essential, as this is a speculative corrective move within a broader market trend.

Japan's Economic Outlook: Steady Progress Amid UncertaintiesHello,
FX:USDJPY will see downside as Japanese economic data remain positive, with recovery ongoing. The BOJ's outlook appears accurate, as the economy continues to progress steadily. Although uncertainties persist, they are unlikely to prevent the BOJ from raising rates in the future. The current account surplus is now Y3.3525 trillion, with a Y2.6911 trillion surplus anticipated. December bank loans increased by 3.1% year-on-year, following rises of 2.9% in November and 2.6% in October. Robust bank loans indicate that Japan Inc is progressing smoothly. There are uncertainties regarding new US Trump administration policies in 2025. Nonetheless, the domestic economy is stable, with trade with the US being the only question. This will be a solid bearish opportunity that will unfold shortly!
No Nonsense. Just Really Good Market Insights. Leave a Boost
TradeWithTheTrend3344

USDJPY LONGMarket structure bullish on HTFs DH
Entry at Daily AOi
Weekly Rejection at AOi
Daily Rejection At AOi
Daily H&S pattern forming (Retest of the neckline)
Previous Structure point Daily
Round Psych Level 143.000
This trade has high potential to create bullish structure
H4 EMA retest
H4 Candlestick rejection
Rejection from Previous structure
Levels 7.11
Entry 90
REMEMBER : Trading is a Game Of Probability
: Manage Your Risk
: Be Patient
: Every Moment Is Unique
: Rinse, Wash, Repeat!
: Christ is King.
