USD/JPY(20250428)Today's AnalysisMarket news:
The Fed's subsequent policy path considers two scenarios: First, there is no substantial progress in the negotiations between the United States and its trading partners. After 90 days, the US tariffs are still high. Weakened economic demand may prompt the Fed to cut interest rates starting in July, and the annual rate cut may reach 100 basis points; second, the negotiations are fruitful, tariffs are reduced, and the demand shock is small, but inflationary pressure continues. The Fed may postpone easing and only cut interest rates slightly in December. For the market, although the easing comes early in the first scenario, the "recession-style" rate cut may suppress risky assets.
Technical analysis:
Today's buying and selling boundaries:
143.40
Support and resistance levels:
144.89
144.33
143.97
142.83
142.47
141.91
Trading strategy:
If the price breaks through 143.97, consider buying, the first target price is 144.33
If the price breaks through 143.40, consider selling, the first target price is 142.83
USDJPY.1000.DUB trade ideas

How To Use The MACD Indicator In 3 Steps Have you ever heard of buying the dip?
Listen I was watching a short news report on CNBC.
It was about how the youngest workforce Gen Z..is now doing blue collar.Am from jumping on a call
With a young buddy of mine.He told he got me, if I ever need a blue collar job in the mines as a truck operator.
Am so happy to know I have options in case I decide to settle down.
I started trading a long time ago.
And the #1 indicator for dip buying has always been the MACD.
So how does it work?
👉When the 12 day moving average crosses above the 26 day moving average.This signals a buy signal.
👉Also notice the historical power bars.When they turn dark green.
👉Also the increase of demand and supply*
*Supply and demand come from macro economics.
Shout out to Mike Maloney for shedding light on this forex pair.I began to follow this particular one about 2 years ago after watching a video he did on gold and silver.
Now will I get a blue collar job? Maybe but I am happy that I sacrificed my time to learn how to trade the financial markets.
Rocket boost this content to learn more 🚀
Disclaimer ⚠️ Trading is risky please learn how to use Risk Management And Profit Taking Strategies.Also feel free to use a simulation trading account before you use real money.

Fundamental Market Analysis for April 28, 2025 USDJPYUSDJPY:
The Japanese yen (JPY) fluctuated in a narrow range in Monday's Asian session and paused its recent pullback from a multi-month high reached last week against its U.S. counterpart. U.S. Treasury Secretary Scott Bessent did not support President Donald Trump's statement that tariff talks with China are underway. That tempered optimism about a quick resolution to trade tensions between the world's two largest economies and provided some support for the safe-haven yen.
Meanwhile, traders pushed back expectations of an immediate interest rate hike by the Bank of Japan (BoJ) due to rising economic risks from US tariffs. However, signs of rising inflation in Japan leave the door open for further BoJ rate hikes this year, which is a big divergence from bets on more aggressive Federal Reserve (Fed) policy easing. This keeps USD bulls on the defensive and also serves as a tailwind for the low-yielding Yen.
Trading recommendation: SELL 143.20, SL 143.60, TP 142.50

USDJPY Long Setup – Fundamental + Sentiment AlignmentAfter a full macro, COT, and sentiment analysis for this week, USDJPY stands out as the cleanest opportunity.
✅ Strong USD support: solid economic growth, persistent inflation, and elevated Treasury yields.
✅ Extremely weak JPY: Bank of Japan remains dovish, with low inflation and no sign of tightening policy.
✅ Risk sentiment: Stable to positive, favoring continuation of USD strength.
Bias: Long USDJPY
Risk: Unexpected shifts in US data or global risk-off shocks.
🔔 If you like this type of detailed analysis combining fundamentals, positioning, and sentiment — make sure to follow me for weekly setups and insights.
Let's trade smarter, not harder. 🚀


USDJPY FORECAST - JEVUSDJPY has been and is currently trading between $160 and $140 since December 2023.
Optimal buy entry will be at ~$140. Sell entries will be at ~$160.
The buy entry at $140 is justified by the apparent demand at that zone for major buyers. Technically, this is corroborated by the consistent Yellow line on the TDI indicator (1hr TF) trending beneath the 30 line level each time price reaches that level; ~$140. Additionally, validation of a continued upward trend is supported with the recovery of the US Dollar since Pres. Trump has expressed confidence that he is close to making trade deals with a number of trading partners.
TP = $155
SL = $137.30

USDJPY ANALYSISUSDJPY has been and is currently trading between $160 and $140 since December 2023.
Optimal buy entry will be at ~$140. Sell entries will be at ~$160.
The buy entry at $140 is justified by the apparent demand at that zone for major buyers. Technically, this is corroborated by the consistent Yellow line on the TDI indicator (1hr TF) trending beneath the 30 line level each time price reaches that level; ~$140. Additionally, confirmation of the upward trend and validation of the upward trend is supported with the recovery of the US Dollar since Pres. Trump has expressed confidence that he is close to making trade deals with number a of trading partners; Japan being of such.
TP = $155
SL = $137.30

Long Trade over the next 1.5-3 months on the USD/JPYAssuming the Flat correction is correct; provides a great long trade waiting for the 1a to pull back to 142.25 to enter with good risk reward ratio. If wave ii is shallow I may trade wave iv otherwise i'll just let it run.

Flat Correction on the USD/JPYThe next move will be in the form of an impulse wave & may just breach the previous high. The real impulse however will start after coming down completing wave 1 of Va.

TOP DOWN ANALYSIS ON USDJPY WEEKLY BIASOn the weekly timeframe, price had a strong rejection weekly candle close right at the monthly/weekly established major zone that closed very bullish hence signaling bullish reversal rhyming with the monthly bullish bias already established!!

TOP DOWN ANALYSIS ON USDJPY MONTHLY TIME FRAME BIASOn the MONTHLY timeframe, we established a major support zone and price is currently rejecting from the zone as the monthly candle have not yet closed. We keep our eyes on it while we go check out the weekly timeframe.

Major Support being testedClean sell would be ideal if the Major support breaks.. until then bias remains bullish.

USDJPY BULLISHMy deeply studied quantitative analysis indicates that price bears an overall bullish sentiment and that it will get to 150.150

Why Yen — When the Dollar Pays 4.5%?USD/JPY recently dropped to its lowest level since September 2024, hovering near the weekly moving average. The market buzzes with concerns over potential U.S. instability and speculation that a Trump administration could weigh on the dollar — prompting some investors to seek safety in the yen.
However, the yield story tells a different tale.
The U.S. still offers an attractive 4.5% overnight interest rate, while Japan lags far behind at just 0.5%. With USD currently undervalued, the yield differential may once again tilt investor preference back toward the dollar.
Looking ahead, a potential rebound toward resistance at 148.639 could be in play in the coming weeks.

USDJPY 15M FORECASTHello guys, I hope you are well let me tell you that the price will sell by filling the FVG and our target will remain until the Bullish OB.

USD/JPY(20250425)Today's AnalysisMarket news:
Federal Reserve-①Hamack: If economic data is clear, the Fed may cut interest rates in June
②Waller: It will take until July to get a clearer understanding of how tariffs affect the economy. If tariffs lead to higher unemployment, interest rate cuts may be initiated. ③The Atlanta Fed GDPNow model predicts that the US GDP growth rate in the first quarter will be -2.5%. ④Kashkari: The frequent announcements from Washington have brought challenges to policymakers and everyone.
Technical analysis:
Today's buying and selling boundaries:
142.79
Support and resistance levels:
143.94
143.51
143.23
142.34
142.06
141.63
Trading strategy:
If the price breaks through 142.79, consider buying, the first target price is 143.23
If the price breaks through 142.34, consider selling, the first target price is 142.06

USDJPY - Analysis and Potential Setups (Intraday- 25.04.25)Overall Trend & Context:
This pair is in an overall uptrend and has reacted off the 140.00 support levels (as well as the 200 EMA on the Daily chart).
Technical Findings:
Price is trading above 25, 50,100 and 200 EMA's on intraday charts.
Powerful break of structure which leaves no question about bullish force.
Current consolidation - Demand needs to be built before continuation.
Notes:
Price is currently at a historic support level however has not closed above daily supply, we are still in the area of doing so.
Manage your risk, take the trade with confirmations only.

USDJPY | 2nd | Bullish momentemUSDJPY is gaining bullish momentum with new higher highs , and once it clears the significant lower high resistance area then it is expected to go upwards.

USDJPY sell setup H4Hello! Friends,
Greetings. Please leave a Like if you like the idea.
Before start talking about technical Let's share your LOVE by giving me LIKES to support this work. Thanks in advance.

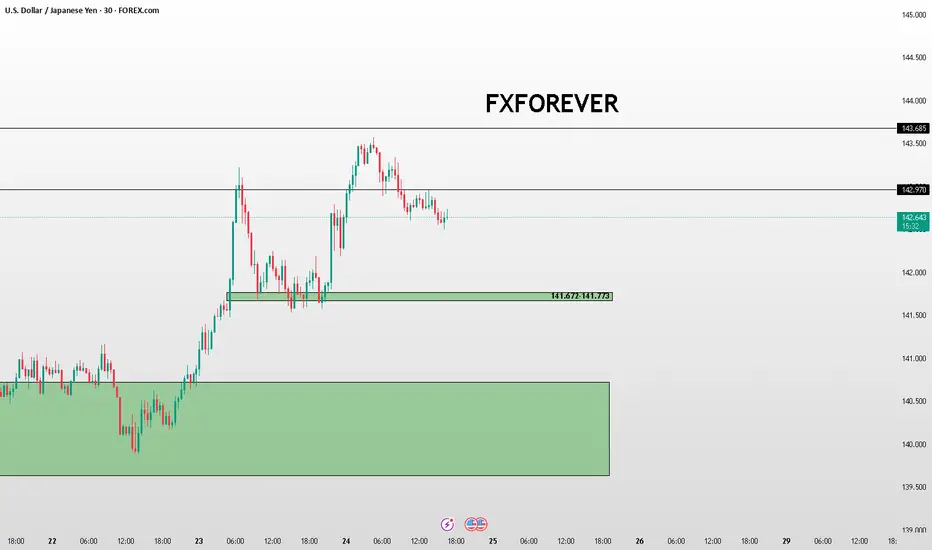
USD/JPY Price Action Update – April 24, 2025📊USD/JPY Price Action Update – April 24, 2025
🔹Current Price: 142.657
🔹Timeframe: 30M
📌Key Resistance Levels:
🔴143.685 – Major Intraday Resistance
🔴142.970 – Minor Structure Resistance (watch for breakout/rejection)
📌Key Demand Zones (Support):
🟢141.672–141.773 – Recent Bullish Breaker Block (potential reaction zone)
🟢139.635–140.722 – Higher Timeframe Demand Zone (strong support and reversal base)
📈Bullish Outlook:
Price is consolidating just below the 142.970 resistance level after a strong bullish rally. A clean breakout above this level could lead to a move toward 143.685. For safer buys, wait for a retest of the 141.672–141.773 zone.
📉Bearish Outlook:
If price rejects from the 142.970 level and breaks below 141.672, expect a deeper correction toward the 139.635–140.722 HTF demand. Monitor for bearish structure shifts or strong rejections near resistance zones.
⚡Trade Setup Tip:
✅Wait for a breakout + retest or confirmation candle
✅Use the 141.672 zone for possible long entries
✅Control risk around key levels with clear invalidation points
#USDJPY #ForexAnalysis #SmartMoneyConcepts #PriceAction #SupplyAndDemand #IntradaySetups #TechnicalAnalysis #FXFOREVER #MarketUpdate #JPY #YenTradeSetup
USD/JPY pair may form a long-term BUY trendBased on the analysis, the USD/JPY pair may form a long-term BUY trend. Based on this analysis, we can try to enter a Buy position with a small risk margin.

USDJPY - Possible Short USDJPY - Possible short position coming our way. The pair is currently trading below Daily Open price which is a strong indication for shorts. I'm currently sitting on my hands and waiting for a break either bullish or bearish. Once one of the trendlines is broken I'll be looking at FVG's to fill either my short or long position. PS. - Feeling shorts today, let's wait for confirmation before we enter.
Happy Trading
AsrielFX

USD/JPY(20250424)Today's AnalysisMarket News:
The United States hit a 16-month low in April. The total number of new home sales in the United States in March was an annualized to a new high since September 2024.
Technical analysis:
Today's buying and selling boundaries:
142.82
Support and resistance levels:
144.93
144.14
143.63
142.01
141.50
140.71
Trading strategy:
If the price breaks through 143.63, consider buying, the first target price is 144.14
If the price breaks through 142.82, consider selling, the first target price is 142.01
