Fundamental Market Analysis for April 18, 2025 USDJPYThe USD/JPY pair is down to 142.25 in thin trading session on Friday. The US Dollar (USD) is declining against the Japanese Yen (JPY) amid concerns over the economic impact of tariffs.
Data released by the Statistics Bureau of Japan on Friday showed that the national consumer price index (CPI) rose 3.6% in March, up from the previous reading of 3.7%. Meanwhile, the national CPI excluding fresh food was 3.2% y/y in March, up from 3.0% previously. The reading was in line with the market consensus.
Finally, the consumer price index excluding fresh food and energy rose 2.9% y/y in March vs. the previous reading of 2.6%. The Japanese Yen remains strong against the US Dollar as an immediate reaction to Japanese inflation data.
However, JPY gains may be limited as Bank of Japan (BoJ) officials signalled a pause in the consideration of interest rate hikes, emphasising the need to monitor uncertainty heightened by US tariff measures.
Economic data from the US on Thursday was mixed. US initial jobless claims fell to their lowest level in two months, signalling a stable labour market. In addition, the Philadelphia Fed index fell short of expectations, a warning shot from the manufacturing sector.
Trade recommendation: SELL 142.05, SL 143.40, TP 139.80
USDJPY.1000.DUB trade ideas
USDJPYUsdjpy has been in a bearish trend, currently reacting off decisional orderblock, with not just a 15min ichoch but also a 1hr ichoch, I have set a sell limit order, let’s see how this goes

USD/JPY Technical and Fundamental Analysis – April 2025Technical Analysis
The USD/JPY monthly chart reveals a strong bullish breakout from a long-standing consolidation zone, defined as the Long-Term Support Region (circa 101.00–122.00). This breakout confirms a major structural shift, where prior resistance has turned into support, signaling the potential for sustained upside momentum.
Upward Price Break: The breakout is clean and supported by significant volume, suggesting institutional participation. The price broke out of the multi-year range and retested the breakout level, respecting it with a strong bullish impulse.
Higher Highs and Higher Lows Channel: Post-breakout, the pair has entered a rising price channel with clearly defined higher highs and higher lows—an essential indicator of bullish market structure. The pair remains well-supported within this upward sloping channel.
Projected Upside: A measured move target (based on the channel and Fibonacci projections) suggests the next key resistance lies around 165.67, offering a 16.72% potential gain from the breakout zone.
Downside Risk: The nearest support lies at 141.94–142.56. A break below this would challenge the structure, but only a drop beneath 136.06 (channel and prior structure support) would invalidate the bullish outlook.
Technically, the pair is in a medium-to-long-term bullish trend. Traders should consider long setups on pullbacks towards support zones unless key structural levels are broken.
Fundamental Analysis
The current macroeconomic landscape provides a mixed but slightly USD-supportive narrative, which aligns well with the bullish technical chart.
Supportive Factors for USD
Hawkish Fed: Fed Chair Jerome Powell signaled that interest rate cuts are off the table for now, citing sticky inflation. The upbeat US Retail Sales report (+1.4% in March) further strengthens the USD by highlighting ongoing consumer strength.
Geopolitical Risks: The escalating US-China trade war and the imposition of tariffs on AI chips are boosting demand for USD as a global reserve currency.
JPY-Supportive Factors (Limiting USD/JPY Gains)
BoJ Rate Hike Prospects: Despite some dovish commentary, the BoJ is still expected to raise interest rates in 2025, which should provide medium-term support for the yen.
US-Japan Trade Optimism: Positive trade negotiations between the US and Japan (with a second meeting planned within a 90-day window) could further strengthen the yen if an agreement is reached.
BoJ Concerns on US Tariffs: Governor Ueda hinted that Japan may take policy action if US tariffs hurt their economy. However, the BoJ is also expected to cut its growth forecast, which limits the yen’s upside strength.
Risk Sentiment: Despite recent global jitters, equity markets in Asia and the US are rebounding, slightly reducing the safe-haven demand for JPY.

perfect USDJPY opportunity to triple your account we are looking at buying the Y wave of the weekly WXY and the move has began

USDJPY 1 HR ChartThis is the 1 HR Chart of USDJPY, I am publishing this chart for further informational analysis. Ideally, further analysis will use smart money concepts, ICT, and wick candle analysis.

USDJPY 15M ChartThis is the 15 M Chart of USDJPY, I am publishing this chart for further informational analysis. Ideally, further analysis will use smart money concepts, ICT, and wick candle analysis.

USDJPY 1 D ChartThis is the 1 D Chart of USDJPY, I am publishing this chart for further informational analysis. Ideally, further analysis will use smart money concepts, ICT, and wick candle analysis.

TRADING PLAN: USDJPY SHORT TRADE SETUP Considering the bearish sentiment in UJ today, and the successful liquidity grab at the Asian session high, we'll take a short position. Our initial target is a 1:1 risk-reward ratio, followed by a 1:2 ratio after securing some profits.

USDJPY (1h) sell updateEarlier this week we had this USDJPY sell setup where price perfectly pulled back into our entry price and even though it's been ranging the trade is now running in profit so if you did take this trade move the stop-loss to break-even (to the entry level) & watch it play out till it hits take profit or you can manually close the trade in profit.

USDJPYbuying USDJPY
sl 142.452
tp 143.907
1% risk on each trade
like an follow me for more
long on USD/JPY

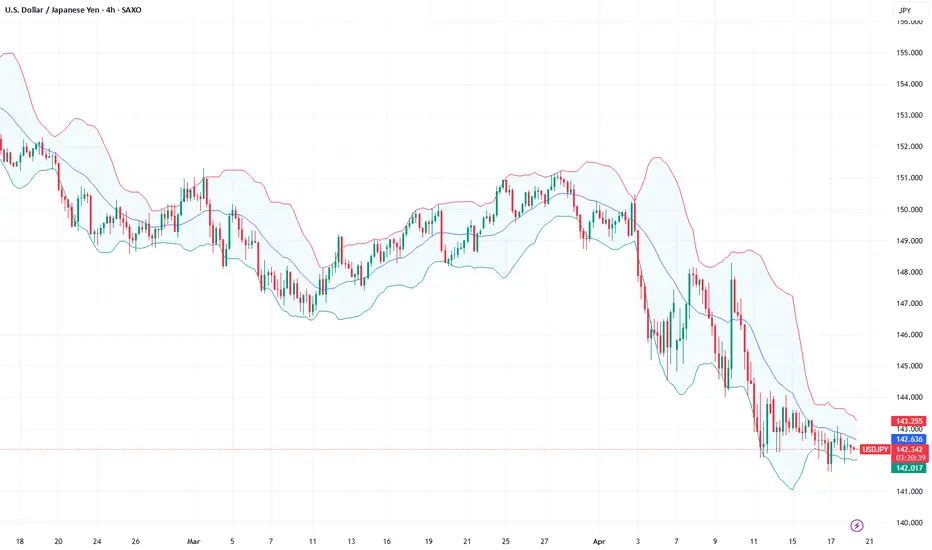
Usdjpy buy 142.52Usdjpy declined below bottom Bolinger band on 4hr . And walking Bolinger down for past couple days. Yesterday it broke up and now resistance becomes support.
Buy on retest of the bottom Bolinger from the top and see if buying will push price to test blue resistance SCD band on 4 hr around 143.50.
If price manages to close below Bolinger again I will stop out.

USDJPY 30M CHART PATTERThis chart shows a bearish setup for the USD/JPY pair on the 30-minute timeframe. The price is moving within a descending triangle pattern, a classic bearish continuation signal.
Here's a breakdown of the setup:
Entry Point: Near the current price level, around 142.5.
Stop Loss: Just above the descending resistance line, slightly above 143.0.
Take Profit: Near the lower support line, around the 141.5–141.6 zone.
The red arrow indicates a bearish move is anticipated from the resistance down toward the support. This setup implies a risk-to-reward ratio that looks favorable if the pattern plays out.
Let me know if you want help analyzing this setup further or creating a trading plan around it.

USDJPY BUY ANALYSIS SMART MONEY CONCEPT Here on Usdjpy price form a demand around level of 142.330 and is likely to continue going up so trader should go for long with expect profit target of 144.628 and 146.947 . Use money management

[_] ONENTRYUSD/JPY - ‘2FIB Strategy’ by ONENTRY
Timeframe: 30 Minutes
Session: London & New York
### **Step 1: Identify the Overnight Range**
- Mark the **high** and **low** of the price range between **00:00 - 06:30 (+2GMT)**.
- Wait for a **clear breakout** with a candle *closing* above (for longs) or below (for shorts) this range.
- Wait for at least one reversal candle.
Step 2: Apply Fibonacci Levels**
- After the breakout, use the **Fibonacci retracement tool**:
- **Anchor Point 1:** Start at the *close* of the last impulse candle wick.
- **Anchor Point 2:** Drag to the *start* of the impulse move - first candle wick of the range.
- Key level for entry: **0.5 and** **0.35 retracement Step 3: Trade Execution**
- **Entry:** Enter on a pullback to **0.5** and **0.35 Fib level** after the breakout.
- **Stop Loss :**
- *Long trades:* Below the **low of the breakout candle wick.**
- *Short trades:* Above the **high of the breakout candle wick.**
- **Take Profit Targets:**
- **TP1:** 1.0 Fib
- **TP2:** 1.25 Fib extension.
- TP3: 1.6 FIB extension
- **TP4:** 2.3 Fib extension (runner position).
### **Step 4: Trade Management**
- Move SL to breakeven when price hits **TP1**.
- Close the running trade before midnight.
Always Test The Strategy

Expanding Channel Broken – Bulls Gaining GroundThe market has officially broken out of the expanding channel to the upside, signaling a shift in sentiment. This breakout could attract momentum buyers, especially if price holds above the previous resistance zone. With fundamentals aligning, we might be looking at the start of a broader bullish continuation. Eyes on retest

USDJPY / 1 DAY / BULLHello Guys;
My USDJPY target level is 147,500.
My target may come a bit late because this trade is a swing trade.
I would appreciate it very much if you do not miss your likes within the framework of Respect for Labor Thank you very much in advance

FONDA JXY/DXY + CHART OVER SELLIt's a long swing bdcause we have a really bad levels on DXY and we have a strong level on JXY, technical, we have an FVG

USD/JPY) demand and supply analysis ); Read The ChaptianSMC Trading point update
shows a bearish setup for USD/JPY on the 1-hour timeframe. Here’s a breakdown
---
1. Trend Context:
Downtrend: The pair is clearly in a bearish channel, forming lower highs and lower lows.
200 EMA (~146.297) is above price and sloping down — confirms bearish bias.
---
2. Key Zones Identified:
Supply Zone (~144.800–145.200): A strong area of resistance where sellers may re-enter. If price returns here, it’s a potential short setup.
Demand Zone (~142.800–143.100): A possible reaction point where short-term buyers may provide a bounce.
Target Point (~141.168): A projected target if the downtrend continues and demand zone fails.
---
3. Expected Scenarios:
Primary Bearish Move:
Price may react from current levels or from the demand zone.
A pullback to the supply zone is expected before continuation downward.
Then, sell-off toward the target zone around 141.168.
Alternate Play:
Price could bounce between the demand and supply zones a bit more before breaking down.
---
4. Indicators:
RSI (~46.37): Shows room to the downside before oversold, aligning with bearish momentum.
Mild bullish divergence in RSI recently, suggesting potential for a small pullback or bounce.
Mr SMC Trading point
---
Summary of Idea:
This is a sell setup:
Sell entries: Ideal around the supply zone (144.8–145.2).
First target: Demand zone (~143.0)
Final target: 141.168
Invalidation: Break above 146.30 (200 EMA and channel resistance).
pales support boost 🚀 analysis follow,)

USDJPY SHORT FORECAST Q2 W16 D17 Y25USDJPY SHORT FORECAST Q2 W16 D17 Y25
GM GM
SUMMARY
- Weekly low long setup
- Weekly order block Long set up
- 15' break of structure is required
- Lower time frame break of structure required
- Price action turn around in bullish direction required. Higher time frame closure. 1H minimum required.
Trade Well.
FRGNT X

.USDJPY NEW (M30) ANALYSIS UPDATES
**🟢 USDJPY Buy Trade Idea (M30 Timeframe)**
**Entry Point:**
- Look for a buy entry around the **142.110 – 141.952** zone. This area has been marked as a strong support zone where price previously reversed.
**Trade Setup:**
- After the price tests this support zone, a potential bullish move is expected.
- Watch for bullish confirmation (e.g., bullish candlestick patterns or a break of short-term resistance) before entering.
**Target Levels:**
1. **Target Point 1:** 142.988
- This is a key resistance zone and a realistic first target.
2. **Target Point 2:** 143.443 – 143.595
- A stronger resistance zone. If price breaks above Target 1 with momentum, you can aim for this level.
**Risk Management:**
- Place a **stop loss** slightly below the support zone (e.g., below 141.900) to protect against false breakouts.
**Market Structure Insight:**
- The chart suggests a potential double bottom forming or a strong bullish bounce from the support, which aligns with the buy setup.
- The recent bullish candles show buying interest returning near the support level.

USDJPY 15mintue ForecastHello guys I hope you are all well Let me tell you that our target right now is the order block bearish, from where we will get a strong sell position, where we can take good profit, and there is a strong sell position, where our target will be the support area.

Short USDJPYEcon factors: Fed to lower interest rates, weakening USD
Weekly: Downtrend
Daily Factor: LHs, LLs
Hourly: Identify a place where liquidity is strong to go short.

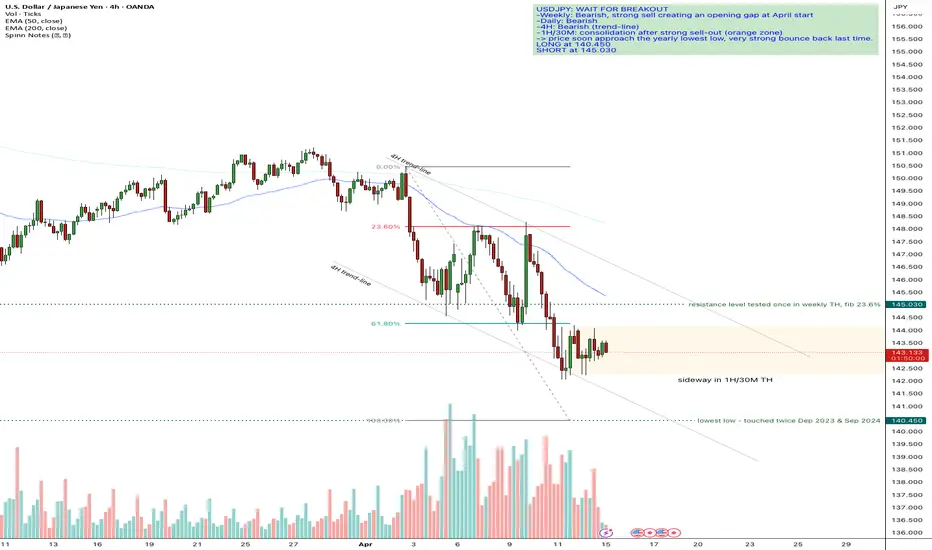
USDJPY: patience is key. 2 high-probability setupsThat lowest low says a lot of things. I think price would respect it. but the sell trend is too strong. I'm open for 2 setups now.