USDJPY LONG FORECAST Q2 W16 D16 Y25USDJPY LONG FORECAST Q2 W16 D16 Y25
Good morning all.
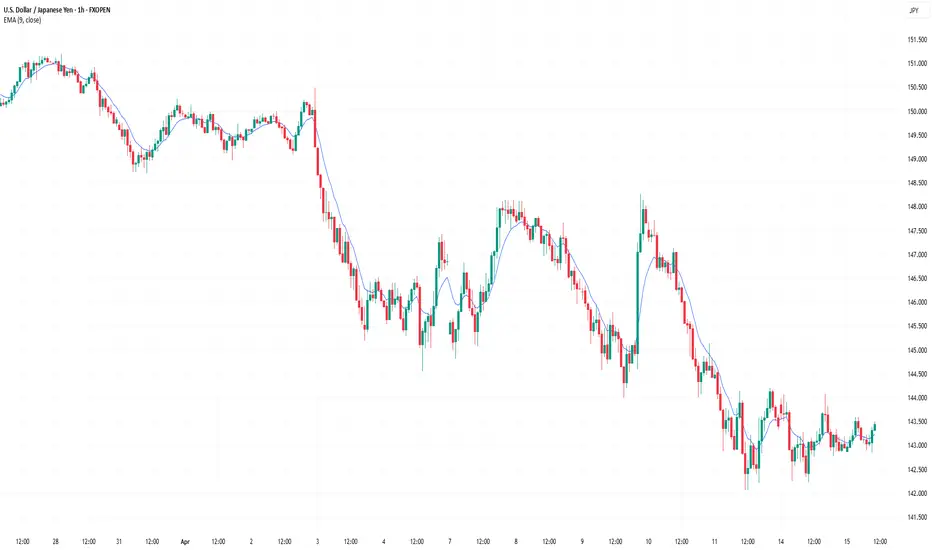
It may look like we are holding onto a bias. I can understand why that assumption is created. However, a short position is invalid for FRGNT whilst in a higher time frame order block long.
As per, that does not mean LONG blindly.
Two set ups illustrated.
1) 15' Break of structure
2) Lower time frame Break of structure without 15' break.
Trading is risky.
Both positions of course come with a side dish of risk and reason to loose. The question is, would you like to see USDJPY explode long without you?
Lets see how price actions plays.
FRGNT X
USDJPY.1000.DUB trade ideas

USD/JPY(20250416)Today's AnalysisMarket news:
U.S. import prices fell 0.1% in March from the previous month, the first month-on-month decline since September last year.
Technical analysis:
Today's buying and selling boundaries:
143.10
Support and resistance levels
144.08
143.72
143.48
142.72
142.48
142.11
Trading strategy:
If the price breaks through 143.10, consider buying, the first target price is 143.48
If the price breaks through 142.72, consider selling, the first target price is 142.48

Complete triangle modelFX:USDJPY It seems that the triangle pattern has become clear and the price has started the first wave of the fifth wave.

Usdjpy reversal coming 15 April 2025Using wave pattern, we can see that price is ranging in what appears to be a triangle
After which, there is a high probability price spike down lower towards 141 region to complete the waves.
Once the pattern is completed, price may start to reverse and retest previous high around 148 region. Hope this works and benefit your trades
Good luck.

Safe-haven currencies gain in uncertain trade landscapeFinancial markets continue to navigate a complex landscape shaped by evolving U.S. trade policies and global economic dynamics. U.S. dollar weakness is at the centre of attention as investors reconsider the greenback’s safe haven status in a world of trade wars.
There has been some relief on the tariff front—at least for now—allowing U.S. and global equities to recover in recent sessions. The Swiss franc and euro have gained significant ground as safe haven flows bolster confidence, while the pound has remained resilient, supported by solid UK economic data and expectations for a more stable Bank of England policy outlook.
In Asia, the yen continues to attract bids, reflecting Japan’s firm stance in upcoming trade talks with the U.S. Overall, markets remain cautiously optimistic, balancing hopes for trade de-escalation against persistent uncertainty from erratic U.S. policy moves.
Looking ahead, key calendar standouts include German wholesale prices, UK employment data, Eurozone industrial production, German and Eurozone ZEW sentiment readings, Canadian inflation, U.S. import and export prices, Empire manufacturing, and various Fed speeches.
Exclusive FX research from LMAX Group Market Strategist, Joel Kruger

USDJPY Analysis — Bullish Setup in Progress
🧠:
During the current Asian session, I expect the market to **grab some liquidity** below recent lows before initiating a bullish move.
From a broader perspective, USDJPY is setting up for a **bullish continuation** over the next few days. My directional bias is supported by a combination of key factors:
🔍 **Key Elements of This Analysis:**
- **Market Structure:** The current downtrend has started to show signs of exhaustion, and a **change of character (CHOCH)** has been observed in lower timeframes.
- **Fair Value Gaps (FVG):** Price is consolidating around a clear imbalance zone. A pullback into this FVG is expected to act as a springboard for the next bullish leg.
- **Liquidity Sweep:** The market is likely to sweep lows for liquidity before pushing higher, aligning with typical behavior during the **Asian range**.
- **Trend Context:** The higher timeframe structure still favors a bullish retracement or reversal, especially if price holds above the lower key level at **141.75–141.67**.
---
🎯 **Key Levels:**
- **Liquidity Zone:** 142.09 – 141.67
- **Bullish Target Zones:**
- TP1: 144.15
- TP2: 147.38
- Final target: 149.08
🛡️ Risk Management
My stop is placed below the identified liquidity zone, maintaining a clean **risk-to-reward structure** that aligns with my daily bias.
This trade idea aligns with my daily execution model combining **trend, liquidity, FVG zones**, and **CHOCH** confirmation. As always, manage risk and stay sharp.
— Emerson Massawe

USDJPY Wave Analysis – 15 April 2025
- USDJPY reversed from long-term support level 142.00
- Likely to rise to the resistance level 144.65
USDJPY currency pair recently reversed up from the support zone between the long-term support level 142.00 (which has been reversing the price from the end of 2023), support trendline of the weekly down-channel from January and the lower weekly Bollinger Band.
The upward reversal from this support zone stopped the previous intermediate impulse wave (3) from last month.
Given the strength of the support level 142.00 and the oversold weekly Stochastic, USDJPY currency pair can be expected to rise to the next resistance level 144.65.

Potential Breakout for a Long Opportunity
The price is currently consolidating within a defined range (marked by the purple box).
Anticipating a bullish breakout above this range to initiate a long position.
2. Entry Condition:
Enter a long trade only after retesting middle of box followed by the 4-hour candlestick closes decisively above the upper boundary of the purple box (approximately above 143.75 based on the chart).

USD/JPY - What to expect as price consolidates above support?Introduction
The USD/JPY pair has been in a clear daily downtrend, marked by a bearish market structure and strong downside momentum. Sellers remain firmly in control, consistently driving prices lower as the pair respects the prevailing trend. Each failed recovery attempt only reinforces the bearish structure, suggesting that the path of least resistance continues to be to the downside.
FVG
Following the most recent drop, the pair is now consolidating just above a key support level. A short-term relief bounce toward the 4-hour Fair Value Gap (FVG) wouldn't be unexpected. This particular FVG, formed during the last leg down, remains unfilled — and such gaps are often revisited before the trend resumes.
Confluences
Notably, this FVG aligns with the Golden Pocket Fibonacci retracement zone (0.618–0.65), adding further confluence and making it a potentially strong resistance area. If price does retrace into this zone, it could face significant selling pressure and resume its move back toward the daily support zone.
Conclusion
While a bounce from daily support is possible, I expect USD/JPY to encounter resistance at the 4H FVG level. This could cap any recovery attempts and signal a continuation of the broader bearish trend.
Thanks for your support.
- Make sure to follow me so you don't miss out on the next analysis!
- Drop a like and leave a comment!

USDJPY SHORT FORECAST Q2 W16 D15 Y25USDJPY SHORT FORECAST Q2 W16 D15 Y25
Good Morning Team !
Here's my short forecast for USDJPY.
Best of luck.
FRGNT X

Still Bearish; Still in the same short I anchored a 5 day vwap from the highest volume. I have no opinion other than I am in a short position

USDJPY (1h) Potential SellAll major time frames indicate this pair will keep going down.
3 point confluences:
1. Created lower highs in both long term & short term tend failing to break the trendlines
2. We've just got a CHoCH (change in character)
3. Sell order block has formed after going sideways for a couple of days which means price is most likely to revisit it before exploding down.
Entry strategy:
Wait for a pullback into the recent sell order block then enter when the stochastics indicator is overbought to help give us a tighter stop-loss.
Alternatively you can set a sell-limit order on the entry price (green line)
Note: price could keep travelling down without doing a pullback
GoodLuck!

USD/JPY 30M CHART PATTERNChart Pattern Observations:
1. Descending Channel Breakout Attempt:
The pair was previously in a well-defined downward channel (marked by orange trend lines).
Price has now exited this channel and is consolidating sideways.
2. Support Zone (Potential Double Bottom):
Price is repeatedly testing a strong support zone around 142.400 - 142.600, forming what looks like a double bottom pattern, which is a bullish reversal signal.
The orange box indicates a clear demand zone where buyers previously stepped in.
3. Projection Path:
A bullish zig-zag arrow is drawn, indicating an anticipated bounce from the support zone, targeting higher level
Targets Analysis:
1st Target: 144.500
This level aligns with minor resistance from previous structure highs.
If the price breaks above the range, this could be the next logical zone where sellers may re-enter.
2nd Target: 145.000
This is a psychological resistance level and also aligns with Ichimoku cloud resistance.
Reaching this level would confirm a significant trend reversal or bullish continuation.

USD/JPY@14.862 BUY SETUP 4h chart analysisHere’s a detailed breakdown of your USD/JPY trade setup based on the latest chart:
---
Chart Analysis (3H Timeframe)
Trend Context:
Prior downtrend with multiple breaks of structure (BOS) and continuation of lower highs/lows.
Recent liquidity sweep + double bottom near 140.518, indicating a potential reversal.
First bullish move breaking structure hints at buyers stepping in.
---
Trade Details:
Entry Point: 142.862 (as marked on the chart)
Stop Loss (SL): 140.518 (below double bottom and liquidity sweep)
Take Profit 1 (TP1): 146.000 (mid-range resistance before 200 EMA & supply zone)
Final Target: 150.014 (top of green box, historical supply area)
---
Support & Resistance Zones:
Support Zones:
1. 140.518 – Strong support (double bottom + liquidity grab zone)
2. 142.000–142.500 – Recent minor support after break and retest
3. 143.300–143.500 – Flip zone, previously support turned resistance
Please hit the like button and
Leave a comment to support for My Post!
Your likes and comments are incredibly motivating and will encourage me to share more analysis with you.
Best Regards, JAMES_GOLD_MASTER_MQL5
Thank you.
Resistance Zones:
1. 146.000 – First real resistance, aligns with 200 EMA
2. 147.300–147.800 – Prior supply zone / consolidation zone
3. 150.014–149.000 – Final target zone, strong resistance and historical supply
---
Additional Observations:
EMA 200 is sloping down; price might react near it before continuing up.
Risk-Reward looks to be around 1:3+, making this a high-probability trade if structure holds.
Potential breaker block or order block just above current price might offer re-entry if it pulls back.

Usdjpy 11 apr positive divergenceAnyone still dare to long usdjpy? If 90% dare not, most probably it can creep u.
Looking for price to close above to add more longs
Good luck to me.


USDJPY Analysis Today: Technical and Order Flow !In this video I will be sharing my USDJPY analysis today, by providing my complete technical and order flow analysis, so you can watch it to possibly improve your forex trading skillset. The video is structured in 3 parts, first I will be performing my complete technical analysis, then I will be moving to the COT data analysis, so how the big payers in market are moving their orders, and to do this I will be using my customized proprietary software and then I will be putting together these two different types of analysis.

USD/JPY H4 | Approaching a multi-swing-high resistanceUSD/JPY is rising towards a multi-swing-high resistance and could potentially reverse off this level to drop lower.
Sell entry is at 143.88 which is a multi-swing-high resistance.
Stop loss is at 144.70 which is a level that sits above the 38.2% Fibonacci retracement and a pullback resistance.
Take profit is at 142.41 which is a multi-swing-low support.
High Risk Investment Warning
Trading Forex/CFDs on margin carries a high level of risk and may not be suitable for all investors. Leverage can work against you.
Stratos Markets Limited (tradu.com):
CFDs are complex instruments and come with a high risk of losing money rapidly due to leverage. 63% of retail investor accounts lose money when trading CFDs with this provider. You should consider whether you understand how CFDs work and whether you can afford to take the high risk of losing your money.
Stratos Europe Ltd (tradu.com):
CFDs are complex instruments and come with a high risk of losing money rapidly due to leverage. 63% of retail investor accounts lose money when trading CFDs with this provider. You should consider whether you understand how CFDs work and whether you can afford to take the high risk of losing your money.
Stratos Global LLC (tradu.com):
Losses can exceed deposits.
Please be advised that the information presented on TradingView is provided to Tradu (‘Company’, ‘we’) by a third-party provider (‘TFA Global Pte Ltd’). Please be reminded that you are solely responsible for the trading decisions on your account. There is a very high degree of risk involved in trading. Any information and/or content is intended entirely for research, educational and informational purposes only and does not constitute investment or consultation advice or investment strategy. The information is not tailored to the investment needs of any specific person and therefore does not involve a consideration of any of the investment objectives, financial situation or needs of any viewer that may receive it. Kindly also note that past performance is not a reliable indicator of future results. Actual results may differ materially from those anticipated in forward-looking or past performance statements. We assume no liability as to the accuracy or completeness of any of the information and/or content provided herein and the Company cannot be held responsible for any omission, mistake nor for any loss or damage including without limitation to any loss of profit which may arise from reliance on any information supplied by TFA Global Pte Ltd.
The speaker(s) is neither an employee, agent nor representative of Tradu and is therefore acting independently. The opinions given are their own, constitute general market commentary, and do not constitute the opinion or advice of Tradu or any form of personal or investment advice. Tradu neither endorses nor guarantees offerings of third-party speakers, nor is Tradu responsible for the content, veracity or opinions of third-party speakers, presenters or participants.

How Can You Use the Ascending Triangle in Trading?How Can You Use the Ascending Triangle in Trading?
An ascending triangle is a chart pattern traders rely on to identify potential breakouts and further price movements. Recognised for its versatility, this pattern can signal trend continuations across all types of markets, including stocks, forex, commodities, and cryptocurrencies*. In this article, we’ll break down how to spot and trade this formation.
What Is an Ascending Triangle?
An ascending or rising triangle is a bullish chart pattern that usually signals a trend continuation. It is framed by two trendlines. The upper line connects highs placed at almost the same level, while the lower line is angled and connects higher lows.
The triangle’s appearance is explained as follows: buyers try to push the price up, but they meet a strong resistance level, so the price rebounds. Still, buyers have strength, which is reflected in higher lows. Therefore, they continue pushing the price until it breaks above the resistance level. The period during which the price bounces back and forth between the two lines depends on the timeframe. On daily charts, the triangle can be in place for over a week.
Note: The ascending triangle is a continuation chart pattern but sometimes it can be used as a reversal signal. It happens when the ascending triangle occurs in a downtrend. It’s the biggest challenge of all the triangles.
The rising triangle is one of the setups in the triangle group. There are also descending and symmetrical formations.
Ascending, Descending, and Symmetrical Triangles: The Differences
The triangle group of patterns comprises ascending, descending, and symmetrical formations.
The ascending triangle is a bullish formation and the descending triangle is bearish. At the same time, the symmetrical triangle is a bilateral setup that signals a rise and a fall in the price.
To distinguish between them, traders draw trendlines. In a rising triangle pattern, an upper trendline is horizontal and connects equal or almost equal highs, while the lower trendline is rising as it connects higher lows. In a descending or falling triangle pattern, the lower trendline is horizontal and connects equal or almost equal lows, while the upper trendline declines, going through lower highs. A symmetrical triangle has a falling upper line that connects lower highs and a rising lower line that connects upper lows.
How Traders Spot the Ascending Triangle
It’s quite easy to identify the formation on a chart. Still, there are a few rules that may help a trader determine its strength.
- The trend strength. Although the setup may appear on any timeframe, traders look for strong long-term trends as risks of a fakeout on low charts are higher.
- Consolidation. Triangles appear when the market consolidates within an overall trend.
- Trendlines. Trendlines must be drawn through at least two points. Still, the larger the number of points, the higher the possibility the setup works.
- Breakout. Can the ascending triangle pattern be bearish? No. It is a bullish formation that appears in a bullish and a bearish trend but always signals a potential price rise.
How Can You Trade Ascending Triangles?
The rising triangle pattern is usually considered a continuation setup formed in an uptrend. Still, if the ascending triangle is in a downtrend, it may signal a trend reversal. The trading rules will be the same in both cases.
As with most chart patterns, triangles have specific rules that help traders place entry and exit points.
Entry
The theory suggests trades go long when the price breaks above the setup's upper boundary. In a conservative approach, traders wait for the price to form at least several candles before entering the market. In a risky strategy, traders open a position as soon as the breakout occurs, and the breakout candlestick closes.
It's worth considering trading volumes as breakouts often turn into fakeouts, meaning the market returns to its previous trend. The chance of a strong breakout is higher if the volumes are high.
However, increased volumes aren't the only tool used to confirm a breakout. Many traders consider trend indicators and oscillators to potentially limit the risks of bad trading decisions.
- If the triangle serves as a continuation setup, it may be helpful to look at the signals of trend-strength indicators, including the average directional index.
- If traders use the ascending triangle as a reversal setup, they usually implement indicators that may signal a trend reversal, including the moving average, the relative strength index, the moving average convergence divergence, and the stochastic oscillator.
Take Profit
A standard take-profit target equals the size of the largest part of the setup and is measured just from the breakout trendline.
Stop Loss
Traders consider several options when placing stop-loss levels. In a conservative approach, they implement the risk/reward ratio, which is usually 1:2 or 1:3 but depends on the trader's willingness to take risks. Also, traders utilise the upper trendline as a threshold and place the stop-loss order just under it.
Note: These are general rules. However, traders can develop their own trading strategies and adjust the pattern's parameters and rules according to their trading approach.
Ascending Triangle: Strategy
In this strategy, traders observe an existing bullish trend and the formation of an ascending triangle, which suggests the potential for a continuation pattern. Incorporating a short-term moving average, such as a 9-period EMA, provides dynamic support, aligning with the trendline to strengthen the setup.
Entries
- Traders typically wait for the price to break through the top trendline of the ascending triangle.
- A strong candle breaking the resistance level adds confidence, though any move above the top trendline can serve as an entry signal.
- The price should also trade above the moving average, offering additional confirmation.
- An order is often placed at the top trendline, anticipating a retracement to this level, which now acts as support.
Stop Loss
- Traders place a stop-loss below the most recent swing low within the triangle.
- For more conservative traders, the stop may be set at any prior swing low, depending on risk tolerance.
Take Profit
- Many traders aim for a risk-reward ratio of 1:2 or 1:3.
- Profits might also be taken at the next strong resistance level, aligning with the market structure.
Rising Triangle: Benefits and Drawbacks
This formation has advantages and pitfalls that traders consider when developing their strategies.
Benefits
- It can be used on any timeframe. Triangles are formed on charts of any period. Still, they might be more effective if the setup appears in a solid trend on a high timeframe.
- It can be used for any asset. Another advantage is that the ascending triangle pattern is used for stock, commodity, cryptocurrency*, and Forex trading.
- Easy to spot. A trader only needs to draw two trendlines to define this setup on the chart.
- Exact entry and exit points. Although traders can develop their entry and exit points, the setup assumes there are specific rules traders with any experience utilise.
Drawbacks
- It can confuse traders. As the rising triangle is used as a reversal and continuation formation, traders with less experience may be confused with its signals.
- False breakouts. The setup works when a price breakout occurs. However, there is a high risk the breakout will appear to be a fakeout, and the price will return.
- The pattern may fail. Aside from a fakeout, there is another risk when trading with triangles. The price may break another side of the formation, and the formation will fail.
- The trading rules may not work. Although specific rules indicate where a trader should place entry and exit points, buyers may be too weak to push the price to the take-profit target.
Final Thoughts
The ascending triangle is one of the more common chart patterns traders use when trading various assets. Still, there is no 100% guarantee that it will work every time you spot it on a price chart. It's vital to remember that every signal must be confirmed with other indicators, chart patterns, and candlesticks. Also, it's a well-known fact that any trade involves risks that should be considered every time a trader enters the market. Improve your skills by practising on different assets and timeframes.
FAQ
How Do You Form an Ascending Triangle?
An ascending triangle is formed when the price action creates a series of higher lows while facing a resistance level, resulting in a horizontal upper trendline and a rising lower trendline. The price consolidates between these two lines before potentially breaking out above the resistance, signalling a bullish continuation.
Is an Ascending Triangle Bullish or Bearish?
The ascending triangle is a bullish pattern. It suggests that buyers are gaining strength as higher lows form, increasing the likelihood of a breakout above the resistance level. There is a descending triangle pattern that usually appears in a downtrend, signalling a downward movement.
How to Enter an Ascending Triangle?
According to the theory, in triangle pattern trading, it’s common to enter the market when the price breaks above the upper trendline of the triangle. In a conservative approach, traders wait for confirmation through several closing candles after the breakout. The increased volume also adds confidence to the trade.
What Is the Ascending Triangle Pattern Retest?
A retest occurs when the price breaks out of the triangle but then briefly falls back to test the former resistance level. A successful retest confirms the breakout and can provide an additional entry point.
How Long Does an Ascending Triangle Pattern Take to Form?
The formation of a bullish triangle pattern can vary based on the timeframe. On daily charts, it can take several days to weeks, while on shorter timeframes, it might form within hours.
What Is the Difference Between an Ascending Triangle and a Rising Wedge?
In comparing the ascending triangle vs. the rising wedge, it’s key to recognise that the rising wedge has converging trendlines, signalling a possible weakening trend, often leading to a bearish reversal. In contrast, an ascending triangle trading pattern typically signals a continuation of the uptrend.
*At FXOpen UK, Cryptocurrency CFDs are only available for trading by those clients categorised as Professional clients under FCA Rules. They are not available for trading by Retail clients.
This article represents the opinion of the Companies operating under the FXOpen brand only. It is not to be construed as an offer, solicitation, or recommendation with respect to products and services provided by the Companies operating under the FXOpen brand, nor is it to be considered financial advice.
Fundamental Market Analysis for April 15, 2025 USDJPYThe Japanese yen (JPY) is declining during the Asian session on Tuesday, which, along with a modest rise in the US dollar (USD), is lifting the USD/JPY pair closer to the mid-143.00s. US President Donald Trump's cancellation of tariffs on major consumer electronics and the signal that he may temporarily exempt the auto industry from the 25 per cent duties continue to support market optimism. This in turn undermines demand for traditional safe-haven assets, including the yen.
However, the rapidly escalating trade war between the US and China and lingering concerns over the potential economic impact of Trump's crippling tariffs should temper market optimism. Meanwhile, expectations that the Bank of Japan (BoJ) will continue to raise interest rates are strongly at odds with bets on more aggressive policy easing by the Federal Reserve (Fed). This, along with hopes of a trade deal between the US and Japan, should limit losses for the low-yielding Yen.
Trade recommendation: SELL 142.80, SL 144.50, TP 140.50

USDJPY InsightHello to all our subscribers!
Please feel free to share your personal opinions in the comments. Don’t forget to like and subscribe!
Key Points
- U.S. President Trump stated that he is considering ways to support car manufacturers, noting that these companies are shifting parts production from countries like Canada and Mexico to the U.S., and that this transition will take time.
- Amid concerns that Trump’s tariff policies and the resulting trade war could harm the global economy, hedge funds and asset managers have been increasing their yen long positions.
- Bank of Japan Governor Kazuo Ueda remarked that uncertainties surrounding domestic and global economies and prices have significantly increased. The market expects that the BOJ will not raise interest rates in its upcoming meeting on May 1.
Key Economic Events This Week
+ April 16: U.K. March CPI, Eurozone March CPI, U.S. March Retail Sales, Bank of Canada (BOC) rate decision
+ April 17: European Central Bank (ECB) rate decision, Speech by Fed Chair Jerome Powell
+ April 18: Easter
USDJPY Chart Analysis
As previously anticipated, USDJPY appears to have formed a bottom around the 142 level and is now attempting to rebound from that support zone. The current upward movement is expected to peak near the 146 level. After that, it is likely to turn downward again and form a new low around the 140–141 range. However, if the price breaks above the 146 level during this rally, there is a possibility it could rise further to the 151 level, which is worth noting.

UsdjpyAs we can see we have the market on de uptrend 1 week and 1 day is on a uptrend so we are waiting for a retracment to the zone so that we can get out entry signal and sell

XAU/USD 15-Min Chart Breakdown!Market Outlook – 15-Minute Chart Analysis
After reaching an all-time high (ATH), price action retraced to 3193 before finding support and consolidating within a rising wedge pattern inside a defined channel. The confluence of the rising wedge, declining volume, and resistance near the upper boundary of the channel suggests a potential bearish move.
We anticipate a downward push to fill the weekend breakaway gap, as illustrated on the chart. As long as the shiny metal remains below the key resistance at 3216, the bearish outlook remains valid, with the target marked clearly on the chart.
However, if price breaks above the channel’s upper boundary and decisively surpasses the 3216 resistance level, we could see a bullish continuation toward 3236.
⚠️ Reminder: Every trade carries risk. Always apply proper risk management to protect your capital first.
Wishing you a successful and green trading week!
