USDJPY BulishThere is market structure shift in daily timeframe. The price is retesting previous resistance (current support) and 23.6 Fibo level and lower line of uptrend channel. There is a divergence in lower timeframe and a price action. Price is targeting 38.2, 50 and upper channel line.
USDJPY.1000.DUB trade ideas

USDJPYUSDJPY is overall bullish on the higher timeframe we had an impulse leg to the upside previously we are currently at a possible low to buy from i am currently long to the upside to 160

USDJPY SHORT Same setup from previous week, Price respected structure, going to look for an opportunity again
Market structure bearish DW
Entry at both Weekly and Daily
Weekly Rejection at AOi
Previous Weekly Structure Point
Daily Rejection at AOi
Previous Structure point Daily
Around Psychological Level 149.000
H4 Candlestick rejection
Levels 9.99
Entry 95%
REMEMBER : Trading is a Game Of Probability
: Manage Your Risk
: Be Patient
: Every Moment Is Unique
: Rinse, Wash, Repeat!
: Christ is King.

USD/JPY 4H – Bearish Setup Forming?The pair is rejecting a major supply zone, signaling potential downside movement. A liquidity sweep paired with imbalance zone may have fueled this reversal, and price is now testing lower levels.
📊 Key Observations:
✔ Supply Zone Rejection: Price reacted strongly from the 151.200–151.500 zone.
✔ Liquidity Grab ($$$): Stops above the highs may have been taken before the sell-off.
✔ Imbalance (IMB) & Demand Zone: The 147.600–147.800 area remains untested and could act as a target.
🔎 Trade Idea: A short position could be considered upon a retracement into the smaller supply zone (150.600–150.900), targeting the demand zone below.

USDJPY POSSIBLE SELL OPPORTUNITY ALERT!Price has been moving in a channel since last week and we might likely see a massive decline in price following the recent drop last Friday. A sell opportunity is envisaged once price drops lower at the button board. Our target profit is 146.772

USDJPY Bullish OutlookHere is my analysis for USDJPY for the coming weeks.
Price is approaching correctively towards the Lower time frame 0.618-0.500 area or Golden ratio, price is currently forming a Running Flat pattern and may react from that Buy zone area. Another scenario, price may be forming an Expanding Flat pattern or may go lower between 0.786-0.618 area before price reacts towards the upside.
Once the price reacts on the Buy zone, it will be expected to impulsively towards the Sell zone area or Higher time frame 0.618-0.500 or Golden ratio. From there, we might be expecting a long-term Bearish Outlook.

USD/JPY BULLS ARE GAINING STRENGTH|LONG
Hello, Friends!
Previous week’s red candle means that for us the USD/JPY pair is in the downtrend. And the current movement leg was also down but the support line will be hit soon and lower BB band proximity will signal an oversold condition so we will go for a counter-trend long trade with the target being at 150.465.
Disclosure: I am part of Trade Nation's Influencer program and receive a monthly fee for using their TradingView charts in my analysis.
✅LIKE AND COMMENT MY IDEAS✅

ShortYesterday, I opened a short position during the Asian session and published my trade set up , but I ended up manually closing the position before the US open becauseI was a bit anxious about US GDP data.
But the main concern was the price was hovering around the major support and resistance area and I could see valid reasons to go long as well.
The obvious reason for the long position was the price was forming big inverted head and shoulder patterns. So, if the price broke above the resistance area, there would have been a great upside potential.
However, after the US session opened, I ended up opening a short position. The reasons are written in the article I published yesterday. Please read that article that is linked below.
But another argument I would like to add for the bear scenario is this.
In Nov-Dec 2024, we had a very similar set up ( dark blue rectangular box in the chart.) At the time, the price was also forming the inverted head and shoulder at the same support/resistance zone. Once it broke the resistance line, it took off to the upside. And that same scenario can unfold this time as well.
However, what is different between Dec 2024 period and the current period are:
1) VWAP (volume weighted average price) drawn from the major low in 24th Sept was working as support but this time the same VWAP is working as resistance.
2) MACD and RSI were moving from bear zone to the bull zone, but this time they are moving to the downside from the bull zone.
Therefore, I think the momentum is to the downside this time. The only time will tell.
My current short position is quite small. However, once the direction becomes more clear I plan to add more position because the move to the downside from here can be quite significant.

JPY/USD Weekly Forecast – Falling Wedge Breakout & Bullish MoveChart Overview
This chart presents a technical analysis of the Japanese Yen (JPY) against the U.S. Dollar (USD) on a daily timeframe, published on TradingView. The setup is based on a Falling Wedge pattern, which has led to a bullish breakout, signaling a potential price rally. Let's break it down step by step.
1️⃣ Identifying the Pattern – Falling Wedge Formation
The primary pattern identified in the chart is a Falling Wedge, which is a well-known bullish reversal pattern.
Characteristics of the Falling Wedge in this Chart:
Two downward-sloping trendlines (black lines) forming a wedge shape.
Price makes lower highs and lower lows, but the distance between highs and lows gradually narrows.
The breakout occurs when price closes above the upper trendline, confirming a potential uptrend.
Key Observations:
✅ The pattern starts forming around September 2024 and continues until December 2024.
✅ A breakout occurs at the end of December 2024, confirming bullish momentum.
✅ After breaking out, the price retests the wedge's upper boundary, acting as new support before continuing upward.
2️⃣ Support & Resistance Zones – Key Price Levels
Support Level:
The support zone is marked in a beige rectangle at the bottom of the chart.
This is where buyers repeatedly stepped in, preventing further decline.
The price touched this area multiple times before reversing upwards, making it a strong demand zone.
Resistance Level:
The resistance zone is identified at the top of the chart (shaded beige area).
This level represents previous price peaks, where selling pressure was strong.
The price is expected to face some resistance when approaching this zone.
3️⃣ Trend Reversal Confirmation & Bullish Structure
After breaking out of the falling wedge, the price has started forming higher highs and higher lows, indicating an uptrend.
Key Trend Indicators:
✔ Curved blue dashed line suggests an upward trajectory, confirming a rounded bottom reversal.
✔ Price is following a trendline support, validating bullish sentiment.
✔ Momentum is strong, and buyers are in control after the breakout.
4️⃣ Trading Setup – Entry, Stop Loss & Take Profit
This analysis is structured into a trading plan with clear risk management.
📌 Entry Point (Buy Confirmation)
Entry is ideal on a retest of the breakout zone or a continuation of the bullish structure.
The recent higher low serves as a great point to confirm trend continuation.
📌 Stop-Loss Placement
Stop-loss is placed at 0.006465 (marked in blue), below the latest support.
This level ensures protection against false breakouts.
📌 Take Profit Target
The target is set at 0.007128, aligning with historical resistance.
If momentum remains strong, the price might push even higher.
5️⃣ Risk-to-Reward Ratio (RRR) & Trade Justification
Risk-to-Reward Analysis:
Stop-Loss: 0.006465 (below support)
Entry Price: Around 0.006671
Target Price: 0.007128
Risk-to-Reward Ratio: Approximately 1:2.5, meaning for every $1 risked, there's a $2.5 potential gain.
Trade Justification:
✔ Falling Wedge breakout is confirmed.
✔ Retest of broken resistance turned support gives an ideal entry.
✔ Bullish trend structure supports the upside move.
✔ Well-defined stop-loss and take-profit levels provide controlled risk exposure.
6️⃣ Final Thoughts & Conclusion
📌 This is a textbook bullish setup based on a Falling Wedge breakout. The combination of pattern breakout, trend structure, and strong support makes this a high-probability trade.
📌 Potential Risks to Watch:
If price fails to hold above stop-loss, it could indicate bullish weakness.
Major macroeconomic news or fundamental events can shift momentum.
📌 Overall Bias: ✅ Bullish towards the 0.007128 target, as long as the price remains above key support zones.

USDJPY analysis week 14🌐Fundamental Analysis
The Federal Reserve (Fed) kept interest rates unchanged in the 4.25% - 4.50% range and forecast core PCE inflation to average 2.8% by year-end. The higher-than-expected inflation data reinforced expectations that the Fed will maintain current interest rates for an extended period. Investors are concerned that these tariffs could add to global inflationary pressures and trigger a recession.
In Japan, the Tokyo CPI rose sharply in March, boosting expectations that the Bank of Japan (BoJ) will continue to raise interest rates this year. The hot inflation data also supported the Yen's appreciation against other currencies.
🕯Technical Analysis
USDJPY is still in a bullish recovery. The pair is facing support at 149.200, preventing further declines. The weekly high around 151.100 is still acting as key resistance before the pair breaks out to 152.000. Conversely, if the trend breaks at 149.200, weekly support is seen at 148.300.
📈📉Trading Signals
SELL USDJPY 151.300-151.100 SL 150.500
SELL USDJPY 152.000-152.200 SL 152.400
BUY USDJPY 149.300-149.100 SL 148.900

Bearish USDJPY 31 Mar 2025Weekly has a bullish trendline breakout but looking ahead Trump's tariff likely to create volatility for OANDA:USDJPY
Looking to sell near 151 after 4H CHOCH.


USDJPY Analysis Today: Technical and Order Flow !In this video I will be sharing my USDJPY analysis today, by providing my complete technical and order flow analysis, so you can watch it to possibly improve your forex trading skillset. The video is structured in 3 parts, first I will be performing my complete technical analysis, then I will be moving to the COT data analysis, so how the big payers in market are moving their orders, and to do this I will be using my customized proprietary software and then I will be putting together these two different types of analysis.

My USDJPY Short Idea 28/03/2025Tokyo CPI came in hot today we have inflation in progress signaling mild-hawkish tone for BOJ. BOJ is known for taking decisions slowly so I do not expect a rate hike to happen soon but we may see it in the very near future. Afterall BOJ Interest rate 0.5 is considered high for its historical data. Aiming for 1.00 interest rate is something huge that few people understands its magnitude.
Taking this short attempt.

ShortI had a few failed short trades in the last few weeks for this pair.
My overall bias is bearish and I must admit having a strong bias cost me. I was too eager to execute a trade and I ended up front running and instead of reacting to the price action.
This morning, I opened two short positions (1 position size divided into two) for USDJPY .
Trade set up:
Entry: 150.945Stop Loss: 151.458
Target 1: 149.680 (blue horizontal line - previous week open price, Fair value gap and order block in 4H) Target 2: 148.306 (Previous week low, fair value gap )
Reasons for short entry:
Weekly:
The price had broken and closed below the previous low at 148.65. It went up again but it is respecting FVG at 150.50 zone.
RSI is starting to enter the bear territory.
Daily:
The price is still below EMA 200 and is respecting FVG at 150.50 zone.
RSI line is still in the bear zone.
4H:
The price dropped and closed below the ascending trendline.
I like the candlestick formations at the FVG - very small candles with upper wicks followed by a large engulfing candle. (1H is better to see the price movement). Sorry, I forgot the name of this formation! RSI is presenting negative divergence.
Ideally, it is better to wait for the price to drop, retest and close below 200EMA in 4H and 4H RSI to dive into bear territory. However, I felt there are enough confluences to support my bias and I like the risk:reward for this set up. Therefore, I decided to open a short position, but my position size is small.
Please let me know what you think.

USD/JPY(20250328)Today's AnalysisToday's buying and selling boundaries:
150.74
Support and resistance levels
151.83
151.42
151.16
150.32
150.06
149.66
Trading strategy:
If the price breaks through 151.16, consider buying, the first target price is 151.42
If the price breaks through 150.74, consider selling, the first target price is 150.32

USDJPY Technical AnalysisF enzo F x—USD/JPY tested the 151.2 resistance but failed to make new highs, retreating to around 150.4.
Bullish Scenario : The primary trend remains bullish, but a close above 151.2 is needed to target 154.8.
Bearish Scenario : A break below 149.540 could spark bearish momentum toward 145.5.

USDJPY Will Go Lower! Short!
Take a look at our analysis for USDJPY.
Time Frame: 3h
Current Trend: Bearish
Sentiment: Overbought (based on 7-period RSI)
Forecast: Bearish
The market is on a crucial zone of supply 150.395.
The above-mentioned technicals clearly indicate the dominance of sellers on the market. I recommend shorting the instrument, aiming at 149.580 level.
P.S
Please, note that an oversold/overbought condition can last for a long time, and therefore being oversold/overbought doesn't mean a price rally will come soon, or at all.
Disclosure: I am part of Trade Nation's Influencer program and receive a monthly fee for using their TradingView charts in my analysis.
Like and subscribe and comment my ideas if you enjoy them!

USD/JPY - Potential TargetsDear Fellow Traders,
This major pair has the potential for a "SHORT" - RSI Divergence.
Upside is limited in the short term.
A strong quality breakout is necessary, either way.
Feel free to ask if anything is unclear.
Thank you for taking the time to study my analysis.

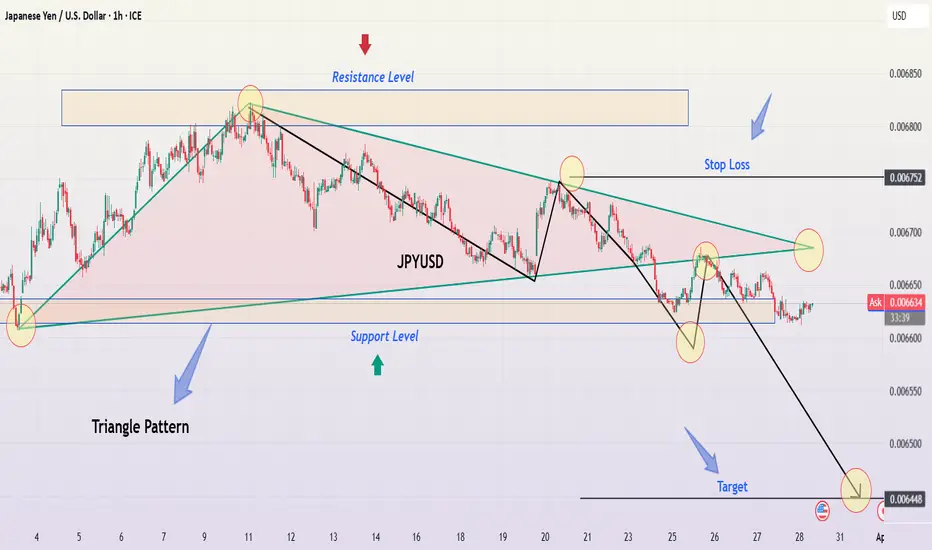
JPY/USD Descending Triangle Breakdown – Bearish Trading Setup📌 Overview: Understanding the Current Market Structure
This analysis focuses on the JPY/USD pair on the 1-hour timeframe, highlighting a well-defined descending triangle pattern, a classic bearish continuation setup. The price action indicates selling pressure increasing as lower highs form, while support remained relatively stable before ultimately breaking down.
This setup suggests a potential trend continuation to the downside, making it a compelling trade opportunity for short-sellers. Let's dive deeper into the technical breakdown, trading strategy, and market expectations.
📊 Technical Breakdown: Chart Pattern Analysis
1️⃣ The Descending Triangle Pattern: A Bearish Signal
The descending triangle is one of the most reliable continuation patterns in technical analysis, often leading to a breakdown when support is breached. This chart confirms the pattern through:
✅ Downward Sloping Resistance Line:
The price tested this level multiple times but was consistently rejected.
Lower highs indicate sellers are dominating and buyers are failing to push higher.
✅ Flat Support Level:
The price found strong support at a key horizontal level, bouncing off multiple times.
However, each bounce became weaker, signaling buyers losing strength.
✅ Breakout & Confirmation:
The final breakdown below support occurred with strong momentum.
The price has now turned previous support into resistance, a bearish confirmation.
🔎 Implication:
A descending triangle breakout to the downside often results in an extended downward move, aiming for the measured move target based on the triangle’s height.
2️⃣ Key Price Levels & Trading Zones
📌 🔴 Resistance Zone (Upper Triangle Boundary):
0.006700 – 0.006750
This level acted as a strong rejection zone, confirming lower highs.
It now serves as a resistance level after the breakdown.
📌 🟢 Support Level (Triangle Base):
This level previously held price from breaking lower multiple times.
However, with each bounce becoming weaker, it finally gave way.
Break & Close below this level confirms the bearish continuation.
📌 🎯 Target Projection (Based on Triangle Breakout):
0.006448 (Final Target) – This level aligns with historical price action and the triangle’s projected move.
📌 🚨 Stop Loss Placement:
Above the last swing high (~0.006752)
If price reclaims this zone, the bearish outlook becomes invalid.
📈 Price Action & Market Sentiment
3️⃣ Bearish Momentum & Breakdown Confirmation
✅ Lower Highs Indicate Weakness:
Buyers attempted multiple recoveries but were consistently rejected at lower levels.
This pattern suggests exhaustion in buying pressure.
✅ Breakout Candle Strength & Volume Confirmation:
The price broke support with strong momentum and increased volume, confirming sellers’ control.
A breakdown without volume is often a fakeout, but this chart shows clear momentum.
✅ Potential Retest Before Further Drop:
After a breakdown, price often retests the broken support before continuing lower.
A pullback to the resistance zone (~0.006650 - 0.006700) could offer an ideal short entry.
✅ Bearish Trend Confirmation:
The price remains below key resistance and continues forming lower lows.
The downtrend structure remains intact, reinforcing the bearish sentiment.
📉 Trading Strategy: How to Trade This Setup?
🔹 Entry Strategy:
Ideal Entry: Short after a pullback to broken support (~0.006650 - 0.006700).
Aggressive Entry: Short immediately on the breakdown if momentum remains strong.
🔹 Stop Loss Placement:
Place above last swing high (0.006752) to avoid being stopped out by noise.
Ensures protection against sudden bullish reversals or fakeouts.
🔹 Take Profit Targets:
✅ First Target: 0.006500 (Psychological level)
✅ Final Target: 0.006448 (Triangle measured move)
🔹 Risk Management:
Use a Risk-to-Reward ratio (RRR) of at least 1:2 for an optimal trade setup.
Never risk more than 2% of total capital per trade.
⚠️ Market Outlook & Key Watchpoints
📌 Scenario 1: Bearish Continuation (High Probability)
If price retests the broken support and faces rejection, expect further downside.
Target remains at 0.006448.
📌 Scenario 2: Fake Breakdown & Bullish Reversal (Low Probability)
If price closes above 0.006750, it invalidates the bearish setup.
In that case, a bullish move towards 0.006800+ is possible.
📢 Final Thoughts:
The bearish breakout is clear, but waiting for a proper pullback before entry is ideal.
Volume confirmation is crucial to avoid fakeouts.
If support turns into resistance, a high-probability short trade is set up.
🔹 What’s your take on this setup? Will JPY/USD reach its target? Drop your thoughts below! 🚀
#JPYUSD #ForexTrading #TechnicalAnalysis #PriceAction
USDJPY has formed a head and shoulders bottom patternOn the 4-hour chart, USDJPY formed a head-and-shoulders bottom pattern and then stabilized upward, with a short-term bullish trend. Currently, the effective support below is around 149.5, and it is expected to continue to rise if it falls back and does not break. The upper resistance is around 152.3, and after breaking through, the upper resistance is around 154.5.

USDJPY Long BiasThe USDJPY pair on the 4H timeframe is forming a bullish structure, showing signs of continuation to the upside. The price is currently trading above key moving averages and consolidating near a resistance-turned-support zone, indicating potential bullish momentum.
Additionally, the formation resembles an inverse head and shoulders pattern, a strong bullish reversal signal. A successful break and retest of the 151.200 zone could confirm further upside movement, with the next key target around 156.700. However, failure to hold above the support zone may lead to a deeper retracement before resuming the uptrend.

Fundamental Market Analysis for March 28, 2025 USDJPYEvent to pay attention to today:
14:30 EET. USD - Core PCE Price Index
USDJPY:
On Friday, during the Asian session, the Japanese yen (JPY) fell to a near four-week low against its US counterpart. This was due to concerns that US President Donald Trump's trade tariffs could affect key domestic exports. However, the release of robust consumer inflation data from Tokyo provided a welcome respite for those anticipating a more hawkish stance from the Bank of Japan (BoJ), potentially paving the way for further interest rate hikes. The BoJ's opinion summary also indicates that a rate hike remains a possibility should the economy and prices align with forecasts.
Additionally, the prevailing risk-off environment, triggered by Trump's imposition of auto tariffs late Wednesday, has served to support the safe-haven yen, leading to a fall in the USD/JPY pair below 151.00 in the last hour. However, the emergence of some US Dollar (USD) dip buying could support the currency pair and help limit further losses. Additionally, traders may adopt a wait-and-see approach, preferring to observe the US Personal Consumption Expenditure (PCE) price index to ascertain the Federal Reserve's (Fed) rate-cutting intentions.
Trade recommendation: BUY 151.000, SL 150.400, TP 151.750
