USD/JPY.. Treand line break out...The USD/JPY trade setup you've described appears to focus on a bullish trend line breakout, but there are inconsistencies in the terminology and risk-reward structure that need clarification. Here's a refined interpretation and analysis:
---
### *Trade Setup Rationale*
1. *Entry Point 149.500 *: Likely triggered by a bullish breakout above a descending trend line (resistance). Entry might be near the breakout level, *assuming the price retests the trend line (now support)*.
- Example: If the breakout occurs around *150.00, a pullback to **150.00-151.00* could serve as the entry zone.
2. *Take Profit (TP) Targets* (mislabeled as "support"):
- *TP1: 152.60* (near prior resistance or a measured move).
- *TP2: 154.80* (extension of the bullish momentum, possibly a multi-month high).
3. *Stop Loss (SL): 148.25* (placed below the trend line/swing low to protect against false breakouts).
---
### *Risk-Reward Considerations*
- *Scenario: Entry at **150.00, SL at **148.25* (175 pips risk).
- TP1 (152.60): *+260 pips* (1:1.5 risk-reward).
- TP2 (154.80): *+480 pips* (1:2.7 risk-reward).
- *Note*: Wider stops may suit swing traders, but ensure alignment with your strategy.
---
### *Key Factors to Validate*
1. *Trend Confirmation*: Confirm bullish momentum with indicators (e.g., RSI >50, MACD crossover).
2. *Fundamentals*: Monitor BoJ intervention risks or Fed policy shifts impacting USD/JPY.
3. *Price Action*: Watch for a clean breakout with volume support and no false spikes.
---
### *Adjusted Trade Plan*
- *Buy Entry: On confirmed trend line breakout (e.g., daily close above **151.00*).
- *TP1: **152.60* (partial profit).
- *TP2: **154.80* (final target).
- *SL: **148.25* (strict risk management).
USDJPY.1000.DUB trade ideas

USDJPY 1.2850 Long in Profit: Next Week's Take - Profit GuideThis week, the long position signal on USDJPY at the 1.28500 level has already started yielding profits. As we look ahead to next week, it is advisable to commence position closing once the price reaches the pre - determined target levels. Rest assured, I will persist in furnishing precise trading signals.
I will share trading signals every day. All the signals have been accurate for a whole month in a row. If you also need them, please click on the link below the article to obtain them.

Yen Weakens Toward 150 on Weak DataThe Japanese yen weakened toward 150 per dollar, extending losses as disappointing business activity data overshadowed the BOJ’s hawkish stance. Japan’s private sector contracted in March for the first time in five months, with manufacturing shrinking for a ninth month and services slipping into negative territory.
While the BOJ kept its policy rate at 0.5% last week and maintained a careful tone before Trump’s predicted April 2 tariff announcement, the central bank is still expected to raise rates later this year due to steady inflation and wage growth. Ongoing external pressures also continued to weigh on the yen.
Key resistance is at 150.30, with further levels at 152.00 and 154.90. Support stands at 147.00, followed by 145.80 and 143.00.

Rebound that I expectThe market open created a gap around the 149.000 level, so I expect a rebound around that level, as a target I expect the 152.000 level to be tested this week. Based on this projection, I will try to play the following setup. Trade carefully.

JPY/USD Head & Shoulders Breakdown – Full Professional Analysis1. Introduction to the Chart Pattern
The JPY/USD chart on the 1-hour (H1) timeframe displays a well-defined Head & Shoulders (H&S) pattern, which is a well-known bearish reversal pattern in technical analysis. This pattern signals the potential end of the previous uptrend and the beginning of a downward move.
A Head & Shoulders pattern consists of three main components:
Left Shoulder: The price rallies to a peak, then retraces.
Head: The price rises higher than the left shoulder, marking the highest point before declining.
Right Shoulder: A lower peak compared to the head, indicating weakening bullish strength.
Neckline: The horizontal support level that, once broken, confirms the bearish trend.
2. Key Levels & Market Structure
🔹 Resistance Level (Supply Zone)
The blue box at the top represents the resistance area, where price action was repeatedly rejected.
This indicates strong selling pressure at this level, preventing further bullish momentum.
🔹 Support Level (Neckline)
The horizontal blue line acts as the support level or neckline of the H&S pattern.
Price has tested this area multiple times, confirming it as a crucial level for trend continuation or reversal.
🔹 Trend Line (Dynamic Support)
The black dashed trend line represents the previous uptrend, which provided support before being violated.
The break of this trend line suggests a weakening bullish structure and increased chances of a bearish move.
3. Breakdown of the Head & Shoulders Pattern
Initial Uptrend:
The market was in a strong uptrend before forming the Head & Shoulders pattern.
Buyers pushed the price higher, making higher highs and higher lows.
Formation of Left Shoulder:
Price reached a peak and then retraced, forming the left shoulder as sellers entered the market.
Formation of the Head:
A strong rally followed, breaking the left shoulder’s peak and reaching a new high, forming the head.
However, buyers started losing momentum, leading to another retracement.
Formation of Right Shoulder:
The price made another attempt to move upward but failed to surpass the head’s high, forming the right shoulder.
This signaled a reduction in bullish strength and potential trend exhaustion.
Neckline Breakdown (Bearish Confirmation):
The price dropped below the neckline (support level), confirming a bearish reversal.
This is the official entry signal for traders looking for a short setup.
4. Expected Market Behavior & Trading Setup
📉 Bearish Confirmation Steps:
Neckline Retest: The price might retest the broken neckline before continuing downward.
Bearish Candlestick Patterns: Look for rejection signals like bearish engulfing or shooting star formations.
Volume Increase on Breakdown: Strong selling pressure confirms the trend continuation.
🎯 Potential Take Profit Levels:
1️⃣ Target 1 (TP1): 0.006492 – This is a short-term support level, where the price might pause before further decline.
2️⃣ Target 2 (TP2): 0.006430 – A stronger support zone, where sellers may take profits.
🚨 Stop Loss Placement:
A stop-loss should be placed above the right shoulder to protect against false breakouts.
This ensures a favorable risk-to-reward ratio.
5. Risk Management & Market Conditions
✅ Entry Strategy: Wait for a retest of the neckline for a higher probability short trade.
✅ Risk-to-Reward Ratio: Ideally, aim for 1:2 or 1:3 to ensure profitability.
✅ Market Catalysts: Be cautious of fundamental news events, as they can cause unexpected volatility.
6. Conclusion: Bearish Outlook for JPY/USD
🔸 The Head & Shoulders pattern breakdown suggests a strong bearish trend reversal.
🔸 If the neckline holds as resistance, a short trade offers a high-probability setup.
🔸 Price may reach TP1 first, then potentially extend to TP2 if selling pressure persists.
📢 Final Verdict: Bearish trend confirmed; watch for short opportunities on retest.
📊 TradingView Tags:
#JPYUSD #HeadAndShoulders #ForexTrading #TechnicalAnalysis #BearishBreakout #ShortTrade

Japanese Yen bulls remain on sidelinesThe negative Purchasing Managers' Index (PMI) report from Japan earlier this Monday has kept the Japanese yen (JPY) down throughout the Asian session. Meanwhile, the safe-haven JPY is being undermined by rumors that US President Donald Trump's reciprocal tariffs will be less severe and more limited than previously expected. The USD/JPY pair returns to the crucial level of 150.00 as the USD maintains its recovery gains from a multi-month low.
The Bank of Japan (BoJ) has the room to continue raising interest rates, but the JPY bears are restrained from making aggressive bets by the expectation that robust wage growth will trickle down to wider inflation trends. Concerns about a slowdown brought on by tariffs, on the other hand, have caused investors to factor in the likelihood that the Fed will soon resume its cycle of rate cuts. It is therefore advisable to exercise caution before positioning for a further increase in the USD/JPY pair, as this could cap gains for the USD and support the lower-yielding JPY.
Technically speaking, in order for bulls to maintain short-term control, the USD/JPY pair must break out above a psychological level of 150.00. If this area is broken, the pair may rise to the 151.00 mark on its way to the monthly peak, which is in the 151.30 range.
Conversely, the 149.00 mark will act as a significant support, followed by the 148.60–148.55 support. Should this support be forcefully broken, the USD/JPY pair may be at risk of accelerating its decline towards the swing low from last week, which was located around the 148.22 region on the way to the 148.00 mark. A decline towards the 147.30 zone may be facilitated by some follow-through selling before spot prices ultimately fall to the 146.55–146.50 range.

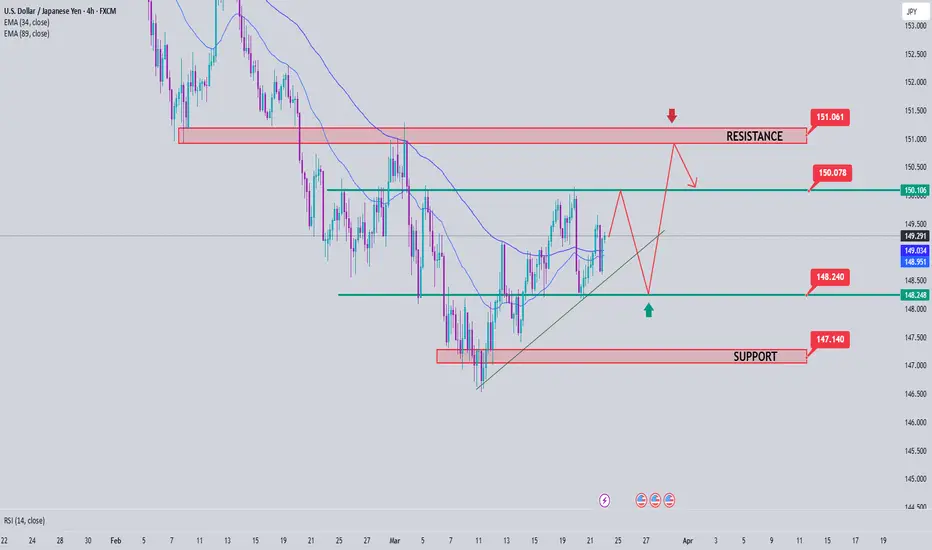
UJ Price Analysis: Key Insights for Next Week Trading DecisionThe USD/JPY pair is currently in a temporary uptrend within a broader consolidation, following a strong bearish move that started at the beginning of the year. The Y149.000 level will be a key zone for our trading decisions.
📌 Key Technical Outlook:
🔹 Price faced selling pressure around Y150.000, leading to a pullback.
🔹 As long as price holds above the ascending trendline & Y149.000, I’ll be looking for buying opportunities in the short term.
🔹 A breakdown and retest of Y149.000 and the trendline would confirm a resumption of the long-term bearish structure.
📌 Major Market Drivers:
🔹 Federal Reserve’s Policy Stance: Powell reiterated that rate cuts are not urgent, keeping the USD supported.
🔹 Trump’s Trade Tariffs: Expected to drive US inflation higher, adding strength to the Dollar.
🔹 Bank of Japan’s Hawkish Expectations: Japan’s largest trade union group (Rengo) secured a 5.4% pay rise, reinforcing expectations that the BoJ will tighten policy further this year.
🔹 Japan’s CPI Cooling Down: Lower inflation in Japan could weaken the Yen and offer USD/JPY support.
📅 Key Economic Events on Our Radar Next Week:
🗓 Tuesday: US S&P Global PMI – A key sentiment indicator for economic conditions.
🗓 Thursday: US GDP (Q4 Final) – A major market mover influencing the Fed’s policy direction.
🗓 Friday: Tokyo CPI & US Core PCE Index – The BoJ and Fed’s preferred inflation measures, critical for future rate decisions.
I’ll be watching how USD/JPY behaves around Y149.000 for confirmation of trend continuation or a bearish continuation. We’ll discuss this in-depth during Forex Morning Mastery tomorrow—stay tuned! 🔥📈 #USDJPY #Forex #MarketAnalysis

USDJPY outlookWhen applying the FIBB Retracement we saw that price has tapped in our 0.786 level whereby that's the level price has to reject at and sell


USDJPY Short Weekly Pattern 15M 4/23/25USDJPY Higher High to drop Shoulder to the 149.800 line then rise to 150.200 to complete drop to the lower levels of 138.800 Short weekly 15 minute buy beginning March 20th 3:15pm-EST Pattern to 149.950 March 24 Monday 3:15pm-EST
149.500 -E
138.800 -TP
151.280 -SL
Disclaimer
The information and publications are not meant to be, and do not constitute, financial, investment, trading, or other types of advice or recommendations supplied

Usdjpy 22 Mar 25 shortLooking forward to short it in phases
Not cast in stone but a possible move
Good luck

USDJPY Analysis week 14Fundamental Analysis
The US dollar continues to attract cash flows as the US Federal Reserve (Fed) is unlikely to cut interest rates in the near future. Fed Chairman Jerome Powell stressed that the Fed is in no hurry to adjust policy amid growing economic uncertainty under President Donald Trump, while warning of the negative impact of tariff policies on growth and inflation.
In the Asia-Pacific region, weak Japanese CPI data in February put pressure on the Yen (JPY), although the growth rate still reached 3%. However, expectations of tightening policy by the Bank of Japan (BoJ) remained after the Rengo union announced a 5.4% wage increase this year.
Technical Analysis
The short-term range is limited to 150,100-148,200. This border area is also very easy to break because there is a lot of buying and selling in this area and just enough factors will break the border area. Krado is aiming for the resistance area of 150,900 which will be the weekly resistance area. Important support when the price breaks out of the trendline is extended to 147,300 for buying force to jump into the market.
USD/JPY - Playing the Retracement SmartThe 4H is locked in a bearish structure, breaking a major recent low—confirming downside intent. But before further drops, I see a play. Liquidity needs to be grabbed, and that means a bullish retracement is on the table.
Dropping to the 30M, I’m looking for confirmation to ride the bulls up into the 4H supply zone—the red zone where sellers are likely waiting. Precision over impulse, patience over noise. Let’s see how price delivers.
Bless Trading!

USDJPY Trend forecast for the day on March 24 2025According to my analysis, the Forex pair USD/JPY will see a fall in the second half of the day. The Advanced Market Timing indicator is also substantiating my analysis. Use your own technical analysis for entries, stops and exis.

USD/JPY(20250324)Today's AnalysisToday's buying and selling boundaries:
149.18
Support and resistance levels:
150.25
149.85
148.59
148.77
148.51
148.11
Trading strategy:
If the price breaks through 148.59, consider buying, the first target price is 149.85
If the price breaks through 149.18, consider selling, the first target price is 148.77

15 minute Trendline breakthe price broke a trendline and now has made a horizontal pullback, which suggest a bullish impulse
WE ONLY TRADE PULLBACKS

Potential bearish reversal?USD/JPY is rising towards the pivot and could reverse to the 1st support which has been identified as an overlap support.
Pivot: 151.21
1st Support: 146.92
1st Resistance: 154.40
Risk Warning:
Trading Forex and CFDs carries a high level of risk to your capital and you should only trade with money you can afford to lose. Trading Forex and CFDs may not be suitable for all investors, so please ensure that you fully understand the risks involved and seek independent advice if necessary.
Disclaimer:
The above opinions given constitute general market commentary, and do not constitute the opinion or advice of IC Markets or any form of personal or investment advice.
Any opinions, news, research, analyses, prices, other information, or links to third-party sites contained on this website are provided on an "as-is" basis, are intended only to be informative, is not an advice nor a recommendation, nor research, or a record of our trading prices, or an offer of, or solicitation for a transaction in any financial instrument and thus should not be treated as such. The information provided does not involve any specific investment objectives, financial situation and needs of any specific person who may receive it. Please be aware, that past performance is not a reliable indicator of future performance and/or results. Past Performance or Forward-looking scenarios based upon the reasonable beliefs of the third-party provider are not a guarantee of future performance. Actual results may differ materially from those anticipated in forward-looking or past performance statements. IC Markets makes no representation or warranty and assumes no liability as to the accuracy or completeness of the information provided, nor any loss arising from any investment based on a recommendation, forecast or any information supplied by any third-party.

USDJPY Short from ResistanceHello Traders
In This Chart USDJPY HOURLY Forex Forecast By FOREX PLANET
today USDJPY analysis 👆
🟢This Chart includes_ (USDJPY market update)
🟢What is The Next Opportunity on USDJPY Market
🟢how to Enter to the Valid Entry With Assurance Profit
This CHART is For Trader's that Want to Improve Their Technical Analysis Skills and Their Trading By Understanding How To Analyze The Market Using Multiple Timeframes and Understanding The Bigger Picture on the Charts

USDJPY at Pivotal MomentThe USD/JPY pair is indeed at a critical juncture as of March 23, 2025, testing resistance around 149. Let’s analyze this based on the historical price levels and the current market context, without inventing unsupported details.
The 149 level has shown significance in recent history. On December 24, 2024, USD/JPY faced resistance near this zone (close to 149.20 per X posts around that time), followed by a rejection that aligns with your noted potential reversal. Similarly, on August 15, 2024, after peaking around 149.50 earlier in the month, the pair reversed sharply, dropping over 13% from July highs near 162 to test 141.70 by early August (Forex.com, Aug 28, 2024). This historical behavior suggests 149 acts as a pivotal resistance where bullish momentum has previously faltered, supporting a possible decline if it fails again.
If USD/JPY breaks above 149, the next major resistance at 157 is plausible, rooted in historical data. On January 9, 2025, the pair approached 157 during a post-election USD rally (X sentiment), and on May 24, 2024, it tested 157.91 amid a bullish leg (J2T.com, Nov 5, 2024). A break above 149 could signal renewed USD strength, potentially driven by Fed policy expectations or yen weakness, targeting 157 as a key ceiling where sellers might reemerge.
Conversely, if 149 holds as resistance and the pair breaks below, support at 140 aligns with past levels. On September 17, 2024, USD/JPY stabilized near 140.25–141.02 after a steep decline (Forex.com, Sep 13, 2024), and on December 28, 2023, it found support at 141.40 (FinanceFeeds, Sep 12, 2024). A drop below 149 could see bears push toward 140, especially if risk-off sentiment or a stronger yen (e.g., BoJ hawkishness) takes hold.
Current price action, hovering around 149.287 as of March 22, 2025 (LiteFinance.org), shows RSI declining below 50 and bearish candlestick patterns like Evening Star near higher levels (e.g., 161.57), hinting at fading bullish momentum (Web ID: 0). The 50-day moving average lies below, and 140.55 is flagged as a key support by analysts, reinforcing 140 target if downside prevails. Posts on X from March 19–22, 2025, also note resistance at 149.50–150, with supports at 147.60–148.80, suggesting a tight range before a decisive move.
USD/JPY is at a pivotal moment at 149. A break above could test 157, backed by January and May 2024 highs, while failure might drive it to 140, consistent with September 2024 and December 2023 supports. The outcome hinges on momentum and broader market triggers like Fed or BoJ signals—watch for a clear break to confirm direction.

USD/JPY Bullish Outlook – Targeting Key Resistance at 150.155USD/JPY Technical Analysis – Bullish Outlook Toward Resistance
Chart Insights:
The price is currently in a recovery phase after a significant drop.
A Fair Value Gap (FVG) zone has been identified, suggesting a potential pullback before further movement.
The target point aligns with the resistance level around 150.155, which acts as a key supply zone.
Potential Scenario:
Price may retrace into the FVG zone around 148.704 – 148.956.
A bullish rebound from this level could drive price toward the resistance at 150.155.
If price reaches the resistance level, further rejection or continuation will depend on market conditions.
Key Levels:
Support Zone: 148.167 – 148.315
FVG Area: 148.704 – 148.956
Resistance Zone: 150.007 – 150.155 (Target area)
Conclusion:
The current structure suggests a bullish bias if price respects the FVG zone for a push higher. However, a break below the FVG could signal further downside movement.

USD/JPY Premium Trade Setup | High-Probability Short OpportunityKey Elements in the Chart:
Uptrend Channel: The price was moving inside an ascending channel but recently broke downward.
Resistance Zone: Marked near the 150.000 level, indicating a key rejection area where sellers are strong.
Sell Zone: A potential short-selling opportunity is identified around 149.300 after a breakdown from the channel.
Support Zone: Located around 148.500, where the price may find temporary buying interest.
Target: The final target for the bearish move is near 147.000, suggesting a further downside potential.
Trading Idea:
Bias: Bearish (selling opportunity after a trendline break)
Entry: Near 149.300 (confirmed rejection)
Target: 147.000
Risk Management: Stop-loss can be placed above the resistance area.
This setup suggests that USD/JPY may continue its downward move after failing to sustain the uptrend. Traders should watch for confirmation signals before entering.

Bearish reversal off pullback resistance?USD/JPY is rising towards the resistance level that is a pullback resistance and could reverse from this level to our take profit.
Entry: 149.68
Why we like it:
There is a pullback resistance level which is a pullback resistance.
Stop loss: 150.16
Why we like it:
There is a pullback resistance level that line sup wit the 138.2% Fibonacci extension.
Take profit: 148.96
Why we like it:
There is a pullback support level.
Enjoying your TradingView experience? Review us!
Please be advised that the information presented on TradingView is provided to Vantage (‘Vantage Global Limited’, ‘we’) by a third-party provider (‘Everest Fortune Group’). Please be reminded that you are solely responsible for the trading decisions on your account. There is a very high degree of risk involved in trading. Any information and/or content is intended entirely for research, educational and informational purposes only and does not constitute investment or consultation advice or investment strategy. The information is not tailored to the investment needs of any specific person and therefore does not involve a consideration of any of the investment objectives, financial situation or needs of any viewer that may receive it. Kindly also note that past performance is not a reliable indicator of future results. Actual results may differ materially from those anticipated in forward-looking or past performance statements. We assume no liability as to the accuracy or completeness of any of the information and/or content provided herein and the Company cannot be held responsible for any omission, mistake nor for any loss or damage including without limitation to any loss of profit which may arise from reliance on any information supplied by Everest Fortune Group.
