USD/JPY🔹Symbol: USD/JPY
🔹Price: 144.428
🔹Stop loss: 144.014
🔹Take profit 1: 145.085
🔹Take profit 2: 145.683
Low risk: % 1.5🟢
📊Check your chart before entering.
♦️Check before use to make sure there is no important news.
USDJPY.1000.DUB trade ideas

Japanese Yen Short-term Outlook: USD/JPY Breakout ahead of NFPThe U.S. Dollar plunged more nearly 12% off the yearly high against the Japanese Yen with USD/JPY rebounding off support at last week near the 2024 low.
Initial resistance now in view at the 100% extension of the recent advance at 146.11 and is backed by the 38.2% retracement at 147.14- both levels of interest for possible topside exhaustion / price inflection IF reached. Broader bearish invalidation is eyed at the 1.6185% extension / 2022 weekly high close at 148.67/73.
Ultimately, a break / daily close below 140.25 is needed to mark downtrend resumption with the subsequent support seen at the March high-day close (HDC) / March high at 137.35/91 and the 78.6% retracement at 134.65.
From a trading standpoint, rallies would need to be limited to 147.14 IF price is heading lower on this stretch with a close below 140.25 needed to fuel the next leg of the decline.
-MB

USDJPY 4h Long Setup | Low Risk High Reward Market broke the descending structure with strong bullish impulse followed by higher lows respecting new trendline
Price retested the previous resistance now turned support zone with a bullish reaction
Entry is taken after confirmation of the retest holding and bullish continuation signs
Entry : 142.494
SL : 140.676
TP : 148.270
RR 1 : 3.2
Price action aligned with short-term bullish reversal structure and clear demand zone defense
Let price do the work

USD/JPY holds within trend line - positive NFP news supports USD🔔🔔🔔USD/JPY news:
➡️ USD/JPY price decreased to 143.80 due to the weakness of the USD after the US employment report decreased compared to the previous month and Average Hourly Earnings m/m decreased slightly, However, NFP was better than the previous forecast, so this is probably support for the USD
Personal opinion:
➡️ USD/JPY is still maintained in the trend line, the buyers have returned after the RSI almost entered the oversold zone and there are signs of slowing down of the sellers.
➡️ Analysis based on resistance - support levels and trend lines combined with EMA to come up with a suitable strategy
Personal plan:
🔆Price Zone Setup:
👉Buy USD/JPY 143.80- 144.00
❌SL: 143.40 | ✅TP: 144.50 – 145.00
FM wishes you a successful trading day 💰💰💰

USDJPY 6 May 2025Price break below uptrend channel and turned bearish
We may see retest the channel and kiss it before saying good bye.
Good luck.

USD/JPY 15M CHART PATTERNThe price action on this 15_ minute USD/JPY chart has landed firmly at a major support zone near 143.700, aligning with the bottom of a well-respected descending channel. This area has historically attracted buying interest, and current price action hints at a potential breakout scenario.
Entry Level: 143.700
First Target: 145.000 – Local resistance and key fib level
Final Target: 146.000 – Previous structural high and breakout projection
Technical Outlook:
The pair is coiled tightly at the edge of a falling wedge, a bullish reversal pattern. A clean break above the upper trendline could trigger a momentum surge. With strong support beneath, the risk-reward profile is favorable.
Strategic Note:
Watch volume and candlestick confirmation—momentum above 144.200 could validate the breakout. This is a classic "buy low in a down channel" setup aiming for a trend shift.

USD/JPY For Bearish as pull-backwait for pull-back near by entry point and then go short
general trend is up trend
current phase is pull-back
have fun :)

USDJPY | Testing Supply & Trendline Resistance at 145.40USDJPY 4H Analysis
Price has rallied back into a confluence zone:
• Descending trendline resistance
• Key supply zone around 145.40
This area has rejected price multiple times in the past. I’m watching closely for:
Bearish Setup:
• Rejection candle or wick above 145.40
• Entry on confirmation below zone
• Target 143.20–141.50
Bullish Breakout Scenario:
• Clean close above trendline + 145.50
• Retest of broken structure
• Target: 147.80+
RSI and momentum tools will help confirm the move.

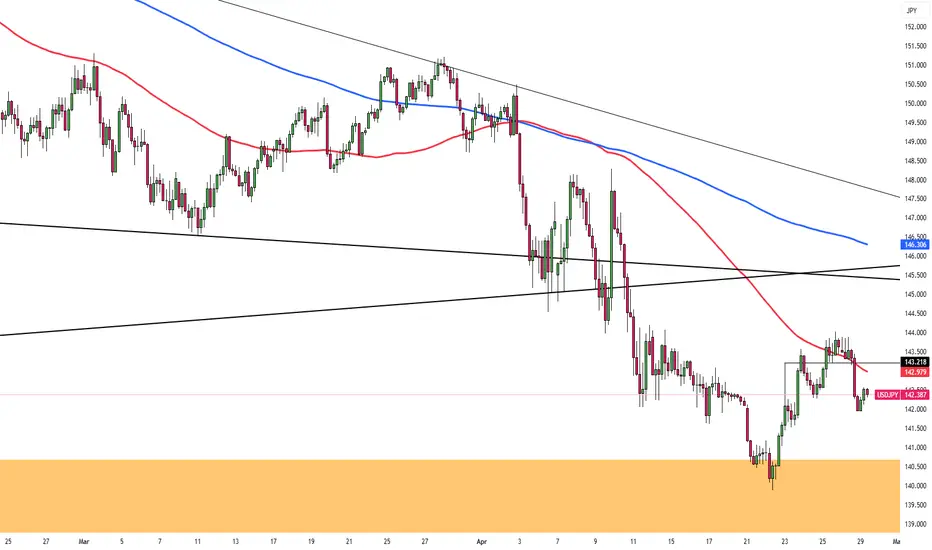
USD/JPY Reversal or Breakdown at Key Support ZoneCANDLE MASTER Update!
Here's a breakdown of the analysis idea shown:
Key Elements:
Support Zone (142.40–142.70 area): Price is currently testing this area. It acted as support in the past and may again lead to a bullish bounce.
Resistance Zone (145.00–146.00 area): Marked as a strong resistance area, near the 200 EMA. This would be a potential target if the support holds.
Next Support Zone (around 140.00–140.50): If the current support fails, price could move toward this lower support level.
Moving Averages:
50 EMA (red): Currently above the price, acting as dynamic resistance.
200 EMA (blue): Also above the price, adding confluence to the resistance zone.
Potential Trade Scenarios:
1. Bullish Reversal:
Price holds at current support.
A bounce occurs, and price targets the resistance zone near 145.90.
Entry could be confirmed with bullish candlestick patterns or a break above a local high.
2. Bearish Breakdown:
Price breaks below the current support zone.
Next support target would be around 140.52.
Entry could be considered after a retest of the broken support as resistance.
This is a classical support/resistance setup with confluence from EMAs and price action zones.

Yen slides as BoJ cuts growth forecastThe Japanese yen continues to lose ground and is sharply lower on Thursday. In the European session, USD/JPY is trading at 144.36, up 0.92% on the day. Earlier, the yen weakened to 144.74, its weakest level since April 10.
There were no surprises from the Bank of Japan, which maintained its key interest rate at 0.5% in a unanimous vote. The BoJ has signaled that it plans to continue hiking rates and normalize policy, but the turmoil caused by US President Trump's tariff policy may delay the next rate increase until after the summer.
The BoJ board cut its growth and inflation forecasts in its quarterly outlook report. The growth forecast for the fiscal year ending March 2026 was slashed to 0.5% from 1.1% in January and inflation is not expected to remain sustainable at 2% until the second half of 2026, a year later than in the January forecast.
The forecast noted that US tariffs would dampen Japan's economy by weighing on global trade and consumer and businesses confidence would be impacted due to the "heightened uncertainties" over the tariffs.
The markets expected a soft US GDP release for Q1 but the 0.3% q/q decline was well below the market estimate of 0.2%. This followed a strong 2.4% gain in the fourth quarter of 2024. The surprise decline was driven by Trump's tariffs, as imports surged ahead of the tariffs taking effect and consumer spending declined.
The weak GDP figure raised the probability of further rate cuts and the markets are looking for up to four rate cuts before the end of the year. The Fed is in a wait-and-see mode, with little chance of a cut in May, but further economic deterioration could force the Fed to cut in June.

USDJPY H1 | Potential pullback supportBased on the H1 chart analysis, the price could potential make a pullback to our buy entry level at 142.76, a pullback support.
Our take profit is set at 144.01, a pullback resistance.
The stop loss is placed at 141.94, a swing low support level.
High Risk Investment Warning
Trading Forex/CFDs on margin carries a high level of risk and may not be suitable for all investors. Leverage can work against you.
Stratos Markets Limited (tradu.com):
CFDs are complex instruments and come with a high risk of losing money rapidly due to leverage. 63% of retail investor accounts lose money when trading CFDs with this provider. You should consider whether you understand how CFDs work and whether you can afford to take the high risk of losing your money.
Stratos Europe Ltd (tradu.com):
CFDs are complex instruments and come with a high risk of losing money rapidly due to leverage. 63% of retail investor accounts lose money when trading CFDs with this provider. You should consider whether you understand how CFDs work and whether you can afford to take the high risk of losing your money.
Stratos Global LLC (tradu.com):
Losses can exceed deposits.
Please be advised that the information presented on TradingView is provided to Tradu (‘Company’, ‘we’) by a third-party provider (‘TFA Global Pte Ltd’). Please be reminded that you are solely responsible for the trading decisions on your account. There is a very high degree of risk involved in trading. Any information and/or content is intended entirely for research, educational and informational purposes only and does not constitute investment or consultation advice or investment strategy. The information is not tailored to the investment needs of any specific person and therefore does not involve a consideration of any of the investment objectives, financial situation or needs of any viewer that may receive it. Kindly also note that past performance is not a reliable indicator of future results. Actual results may differ materially from those anticipated in forward-looking or past performance statements. We assume no liability as to the accuracy or completeness of any of the information and/or content provided herein and the Company cannot be held responsible for any omission, mistake nor for any loss or damage including without limitation to any loss of profit which may arise from reliance on any information supplied by TFA Global Pte Ltd.
The speaker(s) is neither an employee, agent nor representative of Tradu and is therefore acting independently. The opinions given are their own, constitute general market commentary, and do not constitute the opinion or advice of Tradu or any form of personal or investment advice. Tradu neither endorses nor guarantees offerings of third-party speakers, nor is Tradu responsible for the content, veracity or opinions of third-party speakers, presenters or participants.

“UJ | Bullish Intent Locked — Patience Before Precision”“30M just broke structure to the upside — clear bullish intent after sweeping previous highs. Now I’m waiting patiently for price to take out liquidity/IDM to the downside. Once that clears, I’m striking on the 5M CHoCH for the entry. No rush — just precision.”
Bless Trading!

USDJPY Potential Bullish BatOn the 4-hour chart, USDJPY is currently fluctuating. We can currently pay attention to the potential bullish bat pattern and pay attention to buying around 142.43, which is in the previous demand area.

Usd/Jpy 02-May-2025 AnalysisDisclaimer: easyMarkets Account on TradingView allows you to combine easyMarkets industry leading conditions, regulated trading and tight fixed spreads with TradingView's powerful social network for traders, advanced charting and analytics. Access no slippage on limit orders, tight fixed spreads, negative balance protection, no hidden fees or commission, and seamless integration.
Any opinions, news, research, analyses, prices, other information, or links to third-party sites contained on this website are provided on an "as-is" basis, are intended only to be informative, is not an advice nor a recommendation, nor research, or a record of our trading prices, or an offer of, or solicitation for a transaction in any financial instrument and thus should not be treated as such. The information provided does not involve any specific investment objectives, financial situation and needs of any specific person who may receive it. Please be aware, that past performance is not a reliable indicator of future performance and/or results. Past Performance or Forward-looking scenarios based upon the reasonable beliefs of the third-party provider are not a guarantee of future performance. Actual results may differ materially from those anticipated in forward-looking or past performance statements. easyMarkets makes no representation or warranty and assumes no liability as to the accuracy or completeness of the information provided, nor any loss arising from any investment based on a recommendation, forecast or any information supplied by any third-party.

USDJPY Bearish MAYAs we welcome a new month, it is only right that we get a monthly overview. We can see yet another bearish flag here, so for most of may, we will be selling UJ

Yen Under Pressure Ahead of BOJ DecisionThe Japanese yen edged closer to 144 per dollar on Monday, continuing last week’s decline as global trade sentiment improved and the dollar strengthened. Markets responded to a private meeting between Japan’s Finance Minister Kato and U.S. Treasury Secretary Bessent, during which both parties stressed the importance of ongoing discussions on currency matters. Meanwhile, Japan’s trade negotiator is set to visit Washington this week, as the Bank of Japan is expected to maintain interest rates at 0.5%, amid concerns over the economic impact of U.S. tariffs.
Key resistance is at 144.00, with further levels at 145.90 and 146.75. Support stands at 139.70, followed by 137.00 and 135.00.
USD/JPY 1H Chart AnalysisStructure: Bullish, with higher highs (H1) and higher lows consistently forming.
Key Zone: A demand zone around 143.00 – 143.20. Price could pull back here for liquidity before continuing higher.
Current Price: Consolidating near 143.70 after a strong impulse.
Bias: Bullish, as long as price holds above 143.00. Watching for a possible dip into demand before resuming the uptrend toward 144.20 highs.

Hide Divergent system tradingIt's so simple look at indicator Osilator. I used AO to see hide Divergent there. The hide Divergent can tell u. The trend will be change in shortly . It can be corection or change trend current time frame

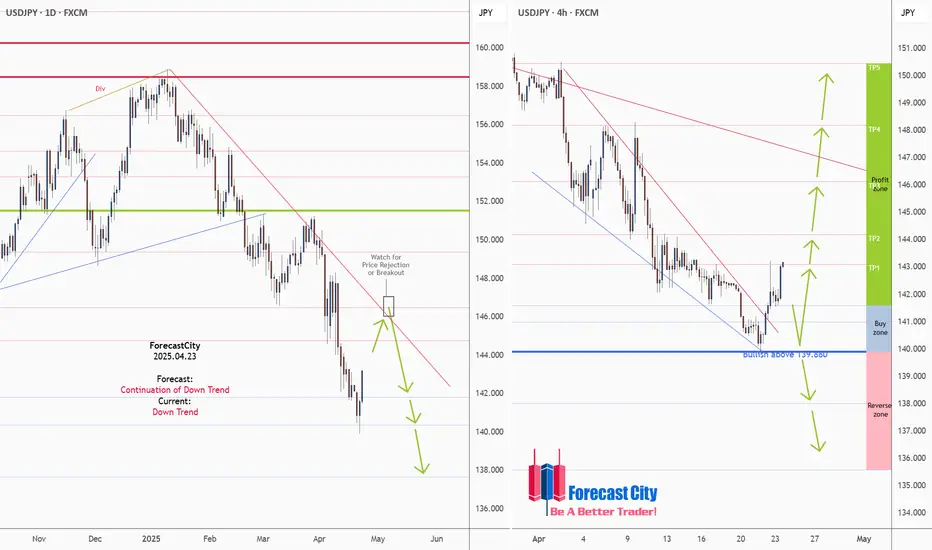
USDJPY Daily & H4 Forecasts, Technical Analysis & Trading IdeaTechnical analysis is on the chart!
No description needed!
FX:USDJPY
________________________________________________________________
❤️ If you find this helpful and want more FREE forecasts in TradingView,
. . . . . . . . Hit the 'BOOST' button 👍
. . . . . . . . . . . Drop some feedback in the comments below! (e.g., What did you find most useful? How can we improve?)
🙏 Your support is appreciated!
Now, it's your turn!
Be sure to leave a comment; let us know how you see this opportunity and forecast.
Have a successful week,
ForecastCity Support Team
USDJPY 1HThe chart you provided is a 1-hour USD/JPY (U.S. Dollar / Japanese Yen) chart showing a bearish pattern analysis. Here's a quick breakdown:
Descending Triangle Pattern: The chart outlines a descending triangle pattern with multiple lower highs (marked by red arrows) and horizontal support (marked by green arrows and a horizontal line).
Sell Zone: The area near the horizontal resistance has been labeled the "Sell Zone," indicating a likely entry point for short positions.
Breakdown Confirmation: The price has broken below the triangle’s support line, followed by a downward arrow and a label "TARGET SUCCESSFUL", suggesting that the bearish target has been hit.
Technical Interpretation: This implies a bearish sentiment with a completed breakdown and target fulfillment, likely indicating a pause or reversal opportunity ahead.
Would you like help identifying the next possible move or support/resistance levels?

EUR/CAD Short, AUD/CAD Short, USD/CHF Long and USD/JPY ShortEUR/CAD Short
Minimum entry requirements:
• If structured 1H continuation forms, 1H risk entry within it.
AUD/CAD Short
Minimum entry requirements:
• 1H impulse down below area of value.
• If tight non-structured 15 min continuation follows, 5 min risk entry within it if the continuation is structured on the 5 min chart or reduced risk entry on the break of it.
• If tight structured 15 min continuation follows, reduced risk entry on the break of it or 15 min risk entry within it.
USD/CHF Long
Minimum entry requirements:
• Tap into area of value.
• 1H impulse up above area of value.
• If tight non-structured 5 min continuation follows, reduced risk entry on the break of it.
• If tight structured 5 min continuation follows, reduced risk entry on the break of it or 5 min risk entry within it.
• If tight non-structured 15 min continuation follows, 5 min risk entry within it if the continuation is structured on the 5 min chart or reduced risk entry on the break of it.
• If tight structured 15 min continuation follows, reduced risk entry on the break of it or 15 min risk entry within it.
USD/JPY Short
Minimum entry requirements:
• If structured 1H continuation forms, 1H risk entry within it.

USD/JPY) bullish trend analysis Read The ChaptianSMC Trading point update
Technical analysis of USD/JPY chart shows a bullish reversal setup. Here’s a breakdown behind the analysis:
1. Downtrend & Channel Breakout:
Price was trending downward within a descending channel (marked “channel trend”).
Recently, the price broke out of the channel, signaling a potential trend reversal.
2. Demand Zone (Diamond Zone):
The yellow box labeled “Diamond Zone” represents a demand/support zone where price previously found buyers.
A retest of this zone is expected before the bullish move.
3. EMA (200):
The EMA (200) is currently above the price but close. A break above this level (142.522) could add to bullish momentum.
4. RSI Indicator:
RSI is showing a bounce off a mid-level (~50), suggesting bullish momentum is gaining.
5. Target Level:
The analysis targets 147.838, which aligns with a prior resistance zone.
The move projects a 5.19% gain (~778.5 pips) from the current setup.
Trading Idea Summary:
Entry: Around the “Diamond Zone” after a successful retest.
Confirmation: Watch for bullish candlestick patterns or a break above EMA 200.
Target: 147.838
Stop Loss (implied): Below the Diamond Zone (~140.000)
Pales support boost 🚀 analysis follow)

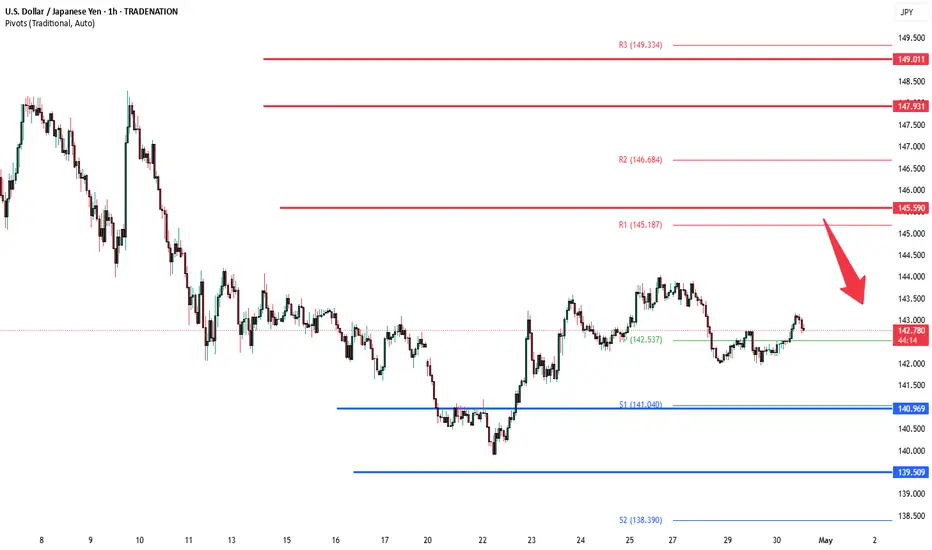
USDJPY INTRADAY downtrend continuationThe USDJPY pair is exhibiting a bearish sentiment, reinforced by the ongoing downtrend. The key trading level to watch is at 145.60, which represents the current intraday swing low and the falling resistance trendline level.
In the short term, an oversold rally from current levels, followed by a bearish rejection at the 145.60 resistance, could lead to a downside move targeting support at 141.00, with further potential declines to 139.50 and 138.40 over a longer timeframe.
On the other hand, a confirmed breakout above the 145.60 resistance level and a daily close above that mark would invalidate the bearish outlook. This scenario could pave the way for a continuation of the rally, aiming to retest the 147.90 resistance, with a potential extension to 149.00 levels.
Conclusion:
Currently, the USDJPY sentiment remains bearish, with the 145.60 level acting as a pivotal resistance. Traders should watch for either a bearish rejection at this level or a breakout and daily close above it to determine the next directional move. Caution is advised until the price action confirms a clear break or rejection.
This communication is for informational purposes only and should not be viewed as any form of recommendation as to a particular course of action or as investment advice. It is not intended as an offer or solicitation for the purchase or sale of any financial instrument or as an official confirmation of any transaction. Opinions, estimates and assumptions expressed herein are made as of the date of this communication and are subject to change without notice. This communication has been prepared based upon information, including market prices, data and other information, believed to be reliable; however, Trade Nation does not warrant its completeness or accuracy. All market prices and market data contained in or attached to this communication are indicative and subject to change without notice.