USDJPY
⚡️After the trendline break and retest
⚡️Expecting market to rally up to the next point of interest.
⚡️Feel free to tell me what you think in the comment section.
USDJPY.1000.DUB trade ideas

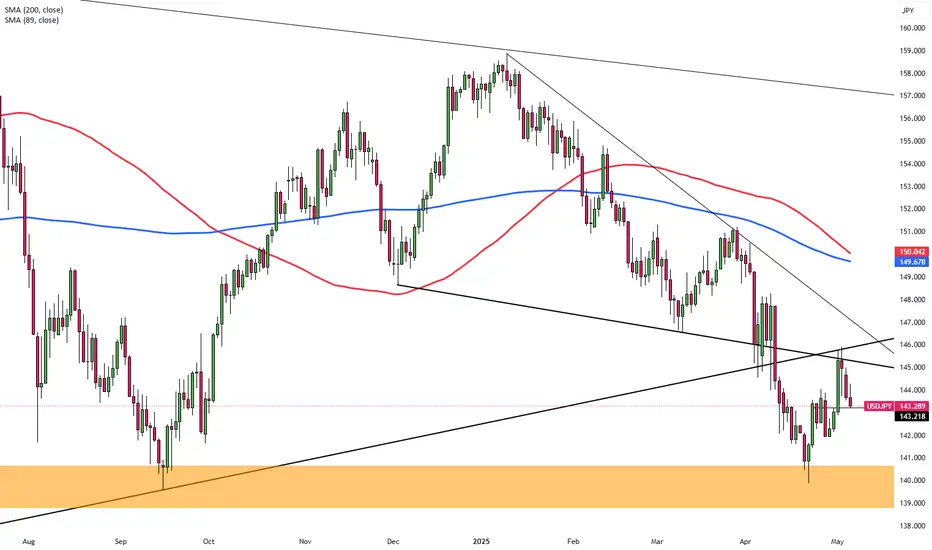
DeGRAM | USDJPY Keeps the Demand Zone📊 Technical Analysis
● USD/JPY has broken the falling-wedge top and is holding above the 142.20 breakout line; that keeps 144.03 → 147.5 in scope.
💡 Fundamental Analysis
● U.S. March retail sales surged 1.4 %, underscoring resilient demand.
✨ Summary
A wedge breakout plus firm U.S. data, a hawkish Fed and a dovish BOJ favour more dollar strength; holding above 142.20 keeps USD/JPY on track for $144.03–147.5.
-------------------
Share your opinion in the comments and support the idea with like. Thanks for your support!

USDJPY, Bullish TrendFundamentally JPY is on bearish side
COT data shows highest long positions opened in JPY
dovish remarks by central bank positions JPY on bearish side
Expected stable rate of USD in coming FOMC rise bulls in USD
seasonality shoes USD bullish in MAY while JPY sideways
Current scenario of trump being lenient on tarrifs also bring momentum
in risk off scenarios i.e lower participant interest in JPY
On technical, USDJPY hit its strong weekly support level
Look for buy setups
68% fib retracement completed
Trendline support intact
currently sideways
buy in parts
buy 1. CMP at small risk
buy 2. upon closing above 144.296
Stoploss below 143.5

USD/JPY "The Gopher" Forex Bank Heist Plan (Swing/Day)🌟Hi! Hola! Ola! Bonjour! Hallo! Marhaba!🌟
Dear Money Makers & Robbers, 🤑💰✈️
Based on 🔥Thief Trading style technical and fundamental analysis🔥, here is our master plan to heist the USD/JPY "The Gopher" Forex Market. Please adhere to the strategy I've outlined in the chart, which emphasizes short entry. Our aim is the Green Zone. Risky level, oversold market, consolidation, trend reversal, trap at the level where traders and bullish robbers are stronger. 🏆💸"Take profit and treat yourself, traders. You deserve it!💪🏆🎉
Entry 📈 : "The vault is wide open! Swipe the Bearish loot at any price - the heist is on!
however I advise to Place sell limit orders within a 15 or 30 minute timeframe most nearest or swing, low or high level for Pullback Entries.
Stop Loss 🛑:
📌Thief SL placed at the nearest/swing High or Low level Using the 1D timeframe (148.800) Day/Scalping trade basis.
📌SL is based on your risk of the trade, lot size and how many multiple orders you have to take.
Target 🎯: 140.000 (or) Escape Before the Target
💰💵💸USD/JPY "The Gopher" Forex Market Heist Plan (Swing/Day Trade) is currently experiencing a Bearish trend.., driven by several key factors.👇👇👇
📰🗞️Get & Read the Fundamental, Macro, COT Report, Quantitative Analysis, Sentimental Outlook, Intermarket Analysis, Future trend targets... go ahead to check 👉👉👉🔗🔗
Detailed Explanation Recap ✨
Fundamentals: Policy divergence + trade risks ⚖️ favor JPY 💪.
Macro: US slowdown 📉 + Japan resilience 🌱 lift JPY.
Global Markets: Risk-off flows 🛡️ + yield dynamics 📜 boost JPY.
COT: Speculative unwinding 📉 aligns with bearish pressure.
Seasonality: Mild JPY edge in April 🌸.
Intermarket: USD weakness 💸 across assets aids JPY.
Quantitative: Technicals confirm bearish 📉.
Sentiment: Broad bearish tilt 😟, retail as contrarian 🚨.
Trend Prediction: Downward bias 📉 across timeframes.
Outlook: Strong bearish case 🐻 with clear targets.
⚠️Trading Alert : News Releases and Position Management 📰 🗞️ 🚫🚏
As a reminder, news releases can have a significant impact on market prices and volatility. To minimize potential losses and protect your running positions,
we recommend the following:
Avoid taking new trades during news releases
Use trailing stop-loss orders to protect your running positions and lock in profits
💖Supporting our robbery plan 💥Hit the Boost Button💥 will enable us to effortlessly make and steal money 💰💵. Boost the strength of our robbery team. Every day in this market make money with ease by using the Thief Trading Style.🏆💪🤝❤️🎉🚀
I'll see you soon with another heist plan, so stay tuned 🤑🐱👤🤗🤩

Reverse HnS at weekly demand zone. weekly deand zone holding strong. From weekly down to 1H, all signals align for a buy. Also spotting a reverse Head & Shoulders forming at the weekly demand zone—classic setup for bullish continuation. Eyes on the breakout.

USDJPYOn the Daily timeframe.
Price reacted to the major zone and reversed upwards, correlating with the established bullish bias on the monthly/weekly timeframe.
Price has already broken the daily trendline and we will be heading to the 4hr timeframe for further confirmation.

USD/JPY Massive Support into BoJThe 140.00 level in USD/JPY has so far held the lows in 2025 after that price did the same in 2024. There was just one day of testing below that price last year and it was around the weekly open of the first FOMC rate cut for the last cycle. Sellers couldn't find much momentum below and a couple days later, when the Fed did actually cut, price put in a higher-low and then eventually reversed in Q4.
But at this stage it looks more and more like we'll see eventual tightening of rates between the U.S. and Japan as inflation in Japan remains elevated and growth in the US somewhat weak.
Timing remains the issue and USD/JPY has brewed several bear traps already this year. It seems unlikely that the BoJ will be too aggressive towards rate moves with the uncertainty of tariffs looming overhead, but tonight's rate decision is a quarterly meeting meaning the Bank will issue updated outlooks, and when they last did this on January 27th it allowed for a lower-low in USD/JPY that continued to spiral lower until the 140.00 bounce that showed last week.
For resistance, 145.00 is a major level as this was prior support that hasn't yet been tested as resistance. - js

USDJPY WeeklyOn the weekly timeframe.
Price had a strong rejection weekly candle close right at the monthly/weekly established major zone that closed very bullish hence signaling bullish reversal rhyming with the monthly bullish bias already established.

#USDJPY: 2050+ Pips Swing Buy| Trend Confirmed| Comment Views? **FX:USDJPY** A significant market movement has confirmed, indicating the potential for a substantial bullish swing that could reach approximately 2050 pips. Three targets have been identified, allowing you to select the one that aligns best with your analysis. The primary catalyst for this move is the reversal of the Japanese Yen (JPY) to a bearish trend. It is crucial to employ precise risk management techniques and exercise caution during this period.
Good luck and trade safely.
Thanks for your support! 😊
If you want to help us out, here are a few things you can do:
- Like our ideas
- Comment on our ideas
- Share our ideas
Team Setupsfx_
❤️

USDJPY Analysis week 19🌐Fundamental Analysis
Signs of rising inflation in Japan still open the door for the BoJ to tighten interest rates further. Moreover, persistent geopolitical tensions and uncertainty over US President Donald Trump’s trade policies have kept investors on edge. Moreover, bets on more aggressive easing by the Federal Reserve will limit any meaningful gains in the dollar and help limit deeper losses for the lower-yielding yen.
🕯Technical Analysis
After a breakout and bounce late Friday, USDJPY is looking to continue its strong uptrend. Last week’s high of 145.900 will act as a temporary buffer before the pair heads towards the weekly resistance around 148.000. On the other side, last week’s liquidity sweep converging with the trendline also creates an important buying zone for the week if the pair reverses. The support level that the bears are strong at is also the weekly support level of interest around 142.000.
📈📉Trading Signals
SELL USDJPY 148.000-148.200 Stoploss 148.500
BUY USDJPY 142.000-141.800 Stoploss 141.500

Can USD/JPY hold THIS key support after a mixed NFP report? The US dollar traded mixed shortly after the NFP was released, as risk-on sentiment remained the prevailing trend. As index futures rose further, commodity dollars extended their gains against the greenback, while the USD/JPY attempted to find support around the key 144.00 - 144.50 area. This zone was resistance in the past so let's see if the UJ will be able to rebound from here later in the session, and in early next week.
NFP comes in stronger, but...
The nonfarm payrolls data “beat” forecasts, with a headline print of 177K vs. 138K eyed. But data for March was revised lower to 185K rom 228K. Revisions to prior two months have taken out 58K from initial estimates. Taken together, this is hardly a beat. But the good news was that full-time employment rose sharply. The unemployment rate, meanwhile, was unchanged at 4.2%.
On the inflation side of things, average earnings came in slightly lower than expected, rising 0.2% on a month-over-month basis, compared with 0.3% expected. Nothing to get too excited over, but potentially good news as far as inflation is concerned – especially after we saw a slightly weaker Core PCE Price Index in mid-week.
NFP was never going to matter much
The market’s focus is on trade war and trade negotiations. We were never going to see any wild market reactions, and so it has so far proved. The US dollar initially spiked then quickly returned to pre-NFP levels. Gold fell, and index futures added onto earlier gains.
Up next: ISM Services PMI on Monday and FOMC on Thursday.
By Fawad Razaqzada, market analyst with FOREX.com

USDJPY 1 day ⚙️ Technical Overview (USD/JPY – 1D)
📉 Trend & Structure:
Rising wedge pattern has been broken to the downside, which is typically a bearish reversal signal.
Price has retested the broken trendline from below near the 147.30 resistance level, confirming structure rejection.
Clear breakdown below both ascending trendlines.
📊 Key Levels:
Resistance:
147.32 (marked on chart, rejected after trendline break)
Minor resistance around 145.90–146.50, former support area turned resistance.
Support:
Nearest horizontal support: 135.00 – 136.00 zone
Major support (and target of measured move): 122.73, also aligned with prior consolidation zone from 2022.
📏 Measured Move:
A measured move suggests a potential drop of -8.43% (~1,229 pips) from the wedge top to the lower trendline support around 133.00–122.70 range.
This aligns with a long-term target near 122.73, which is a major structural level.
🧠 Outlook & Bias:
Bias: Bearish
Momentum: Strong breakdown with retest failure indicates bearish momentum is intact.
Confirmation: A daily close below 144.50 could further confirm downside continuation.
📌 Potential Trade Idea (Not Financial Advice):
Entry: After confirmation below 144.50 or aggressive entry on current retest failure.
SL: Above 147.50 (last swing high & trendline).
TP: First target at 136.00; second target at 122.70

USDJPY Forecast: Haven Appetite Back in SightUSDJPY remains above the 0.618 Fibonacci retracement zone at 139, stemming from the uptrend between January 2023 (127.20) and July 2024 (162.00).
However, the pair is currently trading below resistance at 146, steering the trend back toward key support levels at 142 and 139.
A decisive break below 139 could expose new 2025 lows near 138.30 and 134.60, both key Fibonacci levels.
On the upside, a rebound above 146 may open the way to 149 and 151, testing the grounds for a more sustainable uptrend.
Written by Razan Hilal, CMT

USDJPY Long Setup | Bullish Reversal from Value Area🧠 Technical Breakdown
🔹 Volume Profile Analysis
High Volume Node (HVN) around 144.50–145.20 indicates strong price acceptance.
Price is currently sitting on the Point of Control (POC) or near a zone with high historical transaction volume.
Low Volume Area (LVA) just above this level suggests price may move upward swiftly if buyers take control.
🔹 Key Levels
Entry: ~144.55 (current price where long position begins)
Stop Loss: Just below 144.166 (low-volume rejection zone / support)
Take Profit: ~145.183 — previous resistance level, where selling pressure appeared earlier
🔹 Structure
The previous bearish correction may be coming to an end as price stabilizes at a key support cluster.
The "open & close" line marks a significant balance point, with buyers stepping in to defend it.
Formation of potential higher low, suggesting early signs of a bullish reversal.
🛠 Trade Setup
Bias: Bullish
Entry: Current price zone ~144.55
Stop Loss: Below 144.166 support
Target: 145.183 (resistance)
Risk:Reward: Favorable (approx. 1:2)
✅ Confluences for Long Entry
Strong support zone at 144.166
High-volume accumulation zone (Volume Profile POC)
Price holding above prior open/close levels
Bullish rejection wicks forming at the bottom
⚠️ Watch For
A break and close below 144.166 would invalidate this setup.
Volatility from upcoming USD/JPY macroeconomic events — check the calendar.
🧭 Game Plan
If price continues to hold above 144.366–144.50 zone and shows bullish momentum (like bullish engulfing or strong reaction candles), this setup offers a high-probability long with clean invalidation and solid upside.

Technicals USDJPY Key Level (Horizontal Resistance)
A horizontal resistance zone around 143.90 has been tested multiple times.
Price is currently retesting this zone, marked as an "Entry Zone", suggesting a potential breakout or rejection.
2. Price Structure
Prior downtrend bottomed near 140.00, then formed higher lows, showing a potential trend reversal.
Current price is approaching the resistance with strong bullish candles, indicating possible momentum buildup.
3. Volume
Volume spikes align with swing highs and lows, suggesting these moves were backed by stronger participation.
4. Scenarios Outlined
Bullish Path (Black Arrow): Breakout above the entry zone could lead to targets near 147.00–150.00, continuing a bullish reversal.
Bearish Path (Red Wave): Rejection at the resistance may cause a drop toward 140.00, forming a ranging or distribution pattern.
The Fed (USD) maintains relatively high interest rates, while the BoJ (JPY) continues a dovish stance, creating upward pressure on USD/JPY.

Yen Slips Toward 144 on Stronger DollarThe Japanese yen edged lower toward 144 per dollar on Tuesday, as the U.S. dollar strengthened amid optimism over potential U.S.-China trade talks and investor caution ahead of the Federal Reserve’s policy decision. President Trump suggested a possible reduction in tariffs on Chinese goods. Meanwhile, the Bank of Japan held rates steady but revised its growth and inflation outlook. Trading activity remained subdued due to a public holiday in Japan.
Resistance is located at 145.90, followed by 146.75 and 149.80. On the downside, support levels are at 139.70, then 137.00 and 135.00.
Look Long on USDJPYMarket Need to Go Down But They Seems to getting Rejecting And Weak So I saw The opportunity To BUY Do RISK MANAGEMTNT AND TRADE MANAGEMT DYOR.

nice inside day range reversal. after seeing 3 pushes down in the setup after an inside day . we now see the entry for a range reversal from the inside day . targeting the high of the previous day.
LONG . LONG . LONG

KING OF JPY. "USDJPY"Making interesting moves recently, expecting better this next week. Market analysis: we look forward on NFP NEWS. Dollar has being on the gaining side for a while now, so we expecting more buys and more profit see you on the long run

"USDJPY | Smart Money Premium Trap | Mitigation Block Rejection"⚡ USDJPY Analysis – 30M Timeframe | April 30, 2025
📊 Price Action Summary:
USDJPY has aggressively tapped into the Premium Zone, aligning perfectly with a Mitigation Block and Fibonacci 61.8% golden pocket.
We’re seeing early signs of Smart Money rejection — time to stay sharp! 🧐
🔥 Key Moves:
Premium Zone Entry: Price retraced right into the 61.8–70.5% fib region.
Mitigation Block respected: A known Smart Money zone where trapped sellers from previous moves get wrecked.
Liquidity Build-Up Below: Eyes on the unprotected lows — Smart Money LOVES to grab those.
🧠 What’s Really Going On Behind the Scenes:
Retail traders: "It’s bouncing! Let’s go long!" 🟢💸
Smart Money: "Perfect… let’s trap them for liquidity." 🧊📉
This move screams classic Premium Trap — draw them in, then nuke it. ☠️
🧩 Why This Setup Matters:
Mitigation Block + FVG combo = High-probability rejection zone
Sellers are likely reloading positions here
The Strong High has been established — room to target Weak Lows below
🎯 Trade Setup Idea:
Entry: Inside or just below the Mitigation Block (confirmation from bearish rejection)
Stop Loss: Just above the Strong High (~142.813)
Take Profit Zones:
TP1: Mid-discount (~141.400)
TP2: Weak Low (~139.899) — the real liquidity target 🎯
💬 Pro Tip:
"Mitigation blocks are the sniper’s nest for Smart Money. Get in, get out, get paid." 🎯
Watch the reaction closely inside the purple zone. It’s not just a block — it’s a liquidity recycling station.
🚀 Summary:
✅ Price entered Premium
✅ Mitigation Block tested
✅ Liquidity below waiting
✅ High RRR bearish setup aligning
🧘♂️ Be patient. Wait for confirmation. Let Smart Money leave the trail — then follow.
✍️ Save this chart and study how Mitigation Blocks get respected over and over. It’s not magic — it’s mechanics.
➡️ Comment "SNEAKY SHORT" if you're watching the block trap unfold!
➡️ Tag a trader who still doesn’t believe in Premium/Discount theory. 😂📉📈

Complete Mapping Analysis — USDJPY (H1 Chart)Strategy Focus: Elliott Wave (Impulse) + AO Divergence + Fibonacci Extensions
🔍 1. Current Wave Structure (Elliott Wave Count)
You’ve identified:
A completed Wave 3 (impulse).
A completed or nearly completed Wave 4 correction.
Now projecting Wave 5 to complete the 5-wave impulse.
Substructure breakdown:
Wave 1-2: Clean impulse and pullback.
Wave 3: Strong rally with AO confirming higher momentum peaks.
Wave 4: Corrective move, breaking below the internal trendline (initial break), signaling potential end of correction.
Wave 5 (projected): Final push upward to complete the motive wave.
📊 2. Fibonacci Extension Targets
From Wave 0–3 and Wave 4 retracement:
2.618 extension: ~146.50
2.886 extension: ~146.78
4.236 extension: ~148.22 (Aggressive top for a possible extended fifth)
These are possible Wave 5 termination zones. Confluence with previous supply zones increases likelihood of reversal here.
📉 3. Momentum Confirmation — Awesome Oscillator (AO)
You're watching for:
Bearish Divergence on AO:
Wave 3 had a strong momentum peak.
Expect Wave 5 to push higher in price, but AO shows a lower high, signaling weakening momentum.
This aligns with classic Wave 5 behavior — price extension with momentum exhaustion.
🧭 4. Entry Strategy
Setup: Long entry at Wave 4 bottom.
Entry trigger: Initial break → minor pullback → bullish confirmation candle.
AO: Turns green after red bars = first sign of momentum recovery.
Optional confirmation: Break of short-term structure high (micro Wave 1 in Wave 5).
🎯 5. Take Profit Plan
Layered take-profit strategy based on Fibonacci and AO:
Target Zone Price Area Action
TP1 (Safe) ~1.618 (145.44–145.72) Take partial profit (30–50%)
TP2 (Primary) ~2.618 (146.50) Secure majority of profit (80%)
TP3 (Max/Stretch) ~4.236 (148.22) Optional final push / runner
🛡 6. Stop Loss Strategy
SL placement: Below Wave (4) low (~143.73 zone) or below structure break.
Use structure break or strong bearish engulfing as a reason to exit early if momentum fails.
⚠️ 7. Divergence & Reversal Monitoring
Once price enters your TP2–TP3 zone:
Look for:
AO divergence (price high vs. AO lower high).
Bearish engulfing candles or microstructure breaks.
Weak volume or extended wick rejection.
These may indicate Wave 5 completion and the start of Wave A (correction) or a reversal.
🔄 8. Next Play After Wave 5 Completes
If divergence confirms and reversal begins:
Map corrective structure (ABC).
Short from:
Break of rising wedge/trendline.
AO flips red + break of microstructure.
Target retracement:
0.382 to 0.618 retracement of the full Wave 1–5 impulse.
Target zone: ~144.80 – 143.70
✅ Summary: Strategic Flow
✅ Identify Wave 4 completion → Confirm via initial break + minor pullback.
✅ Long entry for Wave 5 → Enter on bullish candle or structural break.
✅ Track AO → Expect divergence at Wave 5 peak.
✅ Use Fibonacci for TP zones.
✅ Exit with confirmation of divergence and reversal signs.
✅ Option to reverse short post-Wave 5.

USD/JPYThe Japanese Yen (JPY) oscillates in a narrow trading band at the start of a new week and remains close to a two-week trough touched against its American counterpart on Friday. Mixed signals from the US and China temper hopes for a quick resolution of the trade conflict between the world's two largest economies, which, in turn, offers support to the safe-haven JPY. Moreover, expectations that Japan will strike a trade deal with the US turn out to be another factor underpinning the JPY.
Meanwhile, investors have been scaling back their bets for an immediate interest rate hike by the Bank of Japan (BoJ) as rising economic risks from US tariffs overshadow signs of broadening inflation in Japan. This holds back the JPY bulls from placing aggressive bets, which, along with a modest US Dollar (USD) uptick, acts as a tailwind for the USD/JPY pair. However, the divergent BoJ-Federal Reserve (Fed) policy expectations should cap the USD and benefit the lower-yielding JPY.

USDJPY WILL FLY TO 161 !!HELLO TRADES
As you can see a harmonic pattren on Daily Chart for this pair udsjpy we have a great oppritunity to join the Us Dollar Rally we can see a horizontal Support was tested and and its moving to given Targets chart is simple and easy to ready make a proper research before taking any trade these are only dail based valid targets if not break given Stop loss We need ur Supports and comments Stay Tuned for more update ...
