Yen Near 146 as Trade Hopes WeighThe yen hovered near 146 per dollar Friday after a 1.6% drop, pressured by weaker safe-haven demand amid improving US-China trade prospects. China is open to talks after repeated U.S. outreach, while Japan and the U.S. wrapped up a second round of bilateral talks, aiming for a June deal. Domestically, Japan’s jobless rate rose to 2.5% in March, but the labor market stayed tight. The Bank of Japan held rates at 0.5% and cut its growth and inflation outlooks, signaling limited chances of near-term hikes.
Resistance is located at 145.90, followed by 146.75 and 149.80. On the downside, support levels are at 139.70, then 137.00 and 135.00.
USDJPY.1000.DUB trade ideas
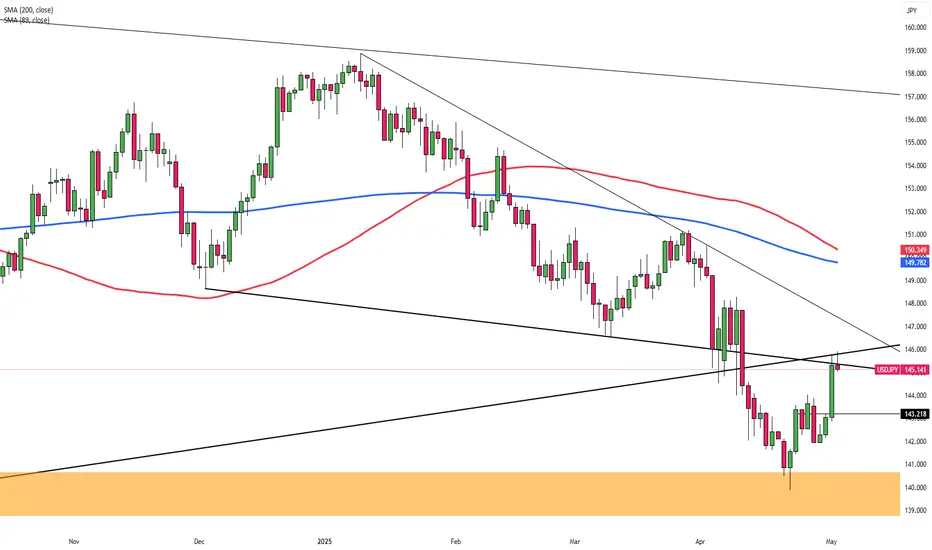
USDJPY Poised to Retest Broken Trendline After Dovish BOJWe discussed the potential battle between bulls and bears near the trendline in our early April post. USDJPY bears ultimately won that battle, and the 140 target was reached. You can view the earlier post here:
Following the breakdown, the 140 level acted as support, and now an upward reaction has begun. At today’s meeting, the BOJ held rates steady at 0.50% as expected, and Governor Ueda delivered a dovish message. The BOJ lowered its core inflation forecast by 0.2% to 2.2% for 2025 and to 1.7% for 2026. The GDP forecast was also revised down from 1.1% to 0.5%.
These projections suggest the BOJ lacks full confidence in consistently reaching its 2% inflation target, though it's very close. However, the risk of tariffs complicates the outlook. Tariffs could negatively impact both growth and inflation, and the BOJ will likely hold off on further rate hikes for at least a few meetings to observe early effects.
In the context of a more dovish BOJ and the dollar index stabilizing after weeks of declines, USDJPY is staging a positive correction. A retest of the broken trendline appears likely, with potential for the short-term rally to extend toward 148.50. Beyond that point, the market will face a critical decision. If the upward reaction stalls, another medium-term move back toward 140 remains a strong possibility.

USD/JPY ANALYSIS📈 Technical Analysis Report – USD/JPY
The USD/JPY pair is exhibiting a strong bullish correction following a recent phase of dollar weakness against the yen.
Price action has regained momentum, moving above key moving averages, which reinforces the bullish technical outlook.
At present, the pair is trading near the 100 level on major technical indicators, suggesting potential for further upside.
Expectations are for a continued rise from the 143 area towards the 148 level in the upcoming sessions, provided the bullish momentum remains intact.
📌 Key Notes:
Bullish momentum strengthening above moving averages.
Target zones identified between 143 and 148.
Monitoring price behavior around critical resistance levels.
⚠️ Risk Warning:
Effective risk management and capital discipline remain essential for sustainable success in financial markets. Always ensure proper position sizing and avoid overexposure.
Wishing all traders continued success! 📊
#Forex #USDJPY #MarketAnalysis #TechnicalOutlook #RiskManagement #TradingSuccess


Buy Opportunity📈 USD/JPY LONG IDEA – Potential Bullish Reversal
USD/JPY is showing signs of a potential recovery after finding strong support at the 141.50 zone, where previous demand and a volume node converge. Price has rebounded off the support and is now looking to reclaim lost ground.
🟢 Entry: 142.812
🎯 Target: 148.157 – Retest of major resistance and volume imbalance above
🛑 Stop Loss: 141.424
📊 Risk/Reward Ratio: 3.87
📆 Estimated Target Date: May 6, 2025
📈 Projected Move: +3.74% or +5.345 points
🔍 Indicators:
Momentum histogram shows fading bearish pressure.
Bullish MACD-style wave forming a potential reversal.
Price holding above value area low (yellow/blue volume zones).
📌 Key Resistance to Watch: 144.072
A break above this could accelerate the move higher toward the 148 zone.

USD/JPY "The Gopher" Forex Bank Bullish Heist Plan (Swing Trade)🌟Hi! Hola! Ola! Bonjour! Hallo! Marhaba!🌟
Dear Money Makers & Robbers, 🤑 💰💸✈️
Based on 🔥Thief Trading style technical and fundamental analysis🔥, here is our master plan to heist the USD/JPY "The Gopher" Forex Market. Please adhere to the strategy I've outlined in the chart, which emphasizes long entry. Our aim is to escape near the high-risk Yellow MA Zone. Risky level, overbought market, consolidation, trend reversal, trap at the level where traders and bearish robbers are stronger. 🏆💸"Take profit and treat yourself, traders. You deserve it!💪🏆🎉
Entry 📈 : The vault is wide open! Swipe the Bullish loot at any price - the heist is on!
Place buy limit orders most recent or swing, low level for Pullback entries.
Stop Loss 🛑:
📍 Thief SL placed at the recent/swing low level Using the 4H timeframe (138.500) Day/Swing trade basis.
📍 SL is based on your risk of the trade, lot size and how many multiple orders you have to take.
🏴☠️Target 🎯: 147.500 (or) Escape Before the Target
🧲Scalpers, take note 👀 : only scalp on the Long side. If you have a lot of money, you can go straight away; if not, you can join swing traders and carry out the robbery plan. Use trailing SL to safeguard your money 💰.
💰💵💸USD/JPY "The Ninja" Forex Money Heist Plan is currently experiencing a bullishness,., driven by several key factors. .☝☝☝
📰🗞️Get & Read the Fundamental, Macro, COT Report, Quantitative Analysis, Sentimental Outlook, Intermarket Analysis, Future trend targets & Overall Score... go ahead to check 👉👉👉🔗🔗🌎🌏🗺
⚠️Trading Alert : News Releases and Position Management 📰 🗞️ 🚫🚏
As a reminder, news releases can have a significant impact on market prices and volatility. To minimize potential losses and protect your running positions,
we recommend the following:
Avoid taking new trades during news releases
Use trailing stop-loss orders to protect your running positions and lock in profits
💖Supporting our robbery plan 💥Hit the Boost Button💥 will enable us to effortlessly make and steal money 💰💵. Boost the strength of our robbery team. Every day in this market make money with ease by using the Thief Trading Style.🏆💪🤝❤️🎉🚀
I'll see you soon with another heist plan, so stay tuned 🤑🐱👤🤗🤩

Analysis of the Latest SignalsRecently, the situation in Ukraine and Russia has remained tense, and the conflict in the Middle East has escalated (such as the confrontation between Israel and the Houthi armed forces in Yemen), prompting funds to flow to traditional safe - haven currencies. However, the Bank of Japan (BoJ) maintained a dovish stance last week and did not clarify the interest - rate - hike path, which limited the upside potential of the yen.
Although inflation in Japan persists and wage growth is strong (the largest increase in 34 years), the BoJ's cautious attitude towards economic recovery has led the market to lower the interest - rate - hike expectations for June and July, putting pressure on the yen.
you are currently struggling with losses, or are unsure which of the numerous trading strategies to follow, at this moment, you can choose to observe the operations within our channel.

Japan Oer handling the DollarUSDJPY is lossing ground and drifting to the downside just after the 145 price leel retest then it will look to shift down to 143 pice level for the week if not days

USDJPY UPDATED Technical Elements Observed
Bullish Reversal Setup:
There’s a greyed box indicating a potential bullish setup.
A projected “W” pattern (double bottom) is drawn within the red zone, implying a reversal formation.
Support Zone (Red Area):
Range: ~143.791 to 144.486
The chart suggests a possible bounce off this zone.
This is the critical demand/support area.
Resistance / Target Zone:
Target price: ~147.056
This implies a ~200-pip upside move from the support area.
Stop-Loss Indication:
Below the red zone: ~143.700
This is a conservative stop-loss based on the chart setup.
Trade Idea Summary (Based on Drawing)
Buy Zone: 144.486–144.000
Stop Loss: ~143.700
Take Profit: ~147.056
Risk:Reward Ratio: Approximately 1:3 or better

USDJPY TRADE SETUPWait for retest the entry level then take a trade for Buy otherwise skip this setup

$USDJPY in Secondary Wave of Major TrendFX:USDJPY currently in secondary wave of major trend. Stochastic indicator showing oversold conditions, EMA beginning to flip. Rejection occurring at the RBS area.

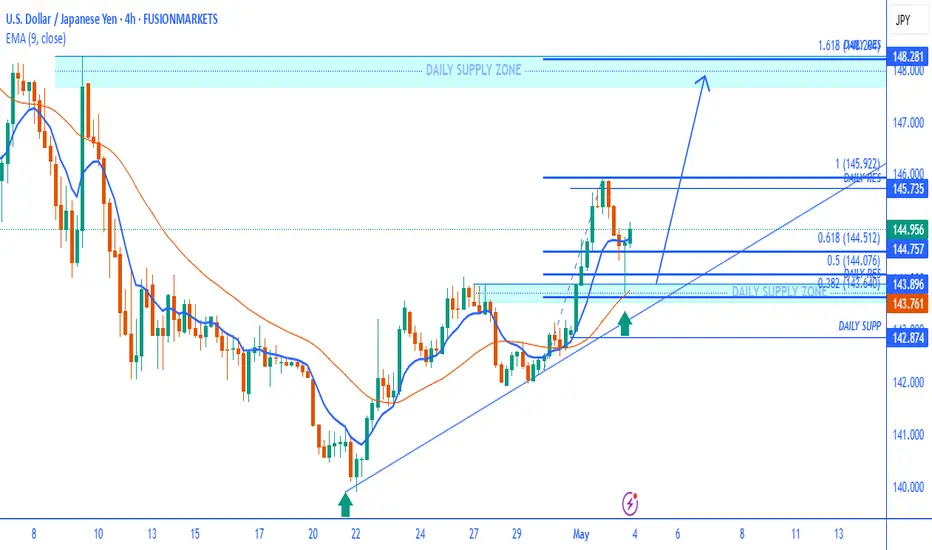
USDJPYThis is a 4-hour chart of the USD/JPY currency pair with a technical analysis setup that includes the following key elements:
Chart Analysis:
Trendline Support:
The price is following an ascending trendline, confirmed by higher lows (marked by green arrows).
The recent bounce off this trendline signals ongoing bullish momentum.
Key Levels & Zones:
Daily Supply Zone: Located around 147.80–148.30, which could act as a major resistance if price rallies.
Daily Resistance: At approximately 145.735, which price is approaching.
Daily Support: Around 142.87, reinforced by trendline confluence.
Fibonacci Retracement:
Fibonacci levels are drawn from the recent swing low to high:
0.382 ≈ 144.05
0.5 ≈ 144.07
0.618 ≈ 144.51
The price recently bounced from near the 0.618 retracement and is now climbing.
Moving Averages:
EMA 9 and EMA 21 are both sloping upward, with the 9 EMA (blue) currently at 144.757 and above the 21 EMA (orange), reinforcing a short-term bullish bias.
Bullish Scenario (highlighted by arrows):
If the price holds above the trendline and the 144.50–144.75 zone, a move toward 145.92 (previous high) is expected.
A break above 145.92 could lead to an extension toward 148.28 (1.618 Fib extension), coinciding with the supply zone.
Summary:
Current Bias: Bullish, as long as price respects the trendline and EMAs.
Confirmation for Continuation: A close above 145.735.
Invalidation: A sustained break below 143.75 or the trendline could shift the bias bearish.

USD/JPY(20250430)Today's AnalysisMarket news:
The European Central Bank expects prices to rise 2.9% over the next 12 months, up from 2.6% in February, according to a monthly survey released on Tuesday. This is the highest level since April 2024. The three-year indicator rose slightly to 2.5%. The ECB's first five-year forecast was 2.1%.
Technical analysis:
Today's long-short boundary:
142.32
Support and resistance levels:
143.13
142.83
142.63
142.01
141.81
141.51
Trading strategy:
If the price breaks through 142.32, consider buying, the first target price is 143.00
If the price breaks through 142.01, consider selling, the first target price is 141.81

USD/JPY SELLUSD/JPY SELL. Trendline break. Trend Strength meter short. Superduper Trend divergence. Good R/R. Tight Stop

USDJPY MARKET IN H4 TIMEFRAME!!Price declined further today and broke Trendline . We might experience further drop to a low level of 139.959 as we anticipate fed interest rate tomorrow. A sell opportunity is envisaged.

Massive H&S on USDJPYOver the weekend the US dollar began to fall rapidly against the Taiwan Dollar (TWD). Yesterday and Today we are beginning to see a US dollar sell off against the Chinese Yuan as well. Then we have a massive bearish setup against the Japanese Yen, the 3rd most traded currency after the USD and Euro. The DXY is just below 100 and still holding, but individual currency pairs are telling a different story. Could this mark the beginning of the US dollar collapse?


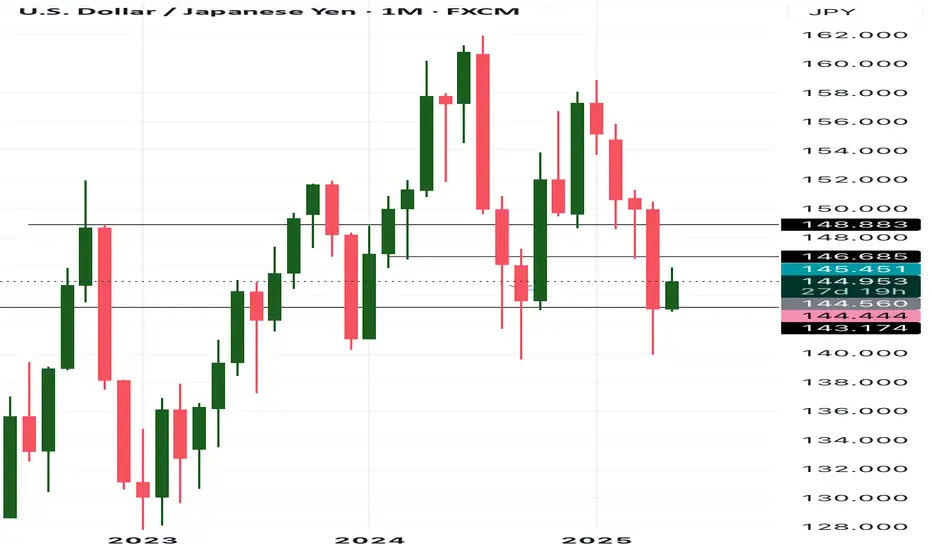
USDJPY Top down analysisOn the MONTHLY timeframe.
we established a major support zone and price is currently rejecting from the zone as the monthly candle closes exactly at that zone.
We keep our eyes on it while we go check out the weekly timeframe.
Trade Idea: Buy USDJPY from the highlighted demand zone (around The market has recently revisited a key demand zone highlighted around the 142.195 level on the 1-hour chart. Price previously reacted strongly to this area, suggesting the presence of institutional interest. After a sharp decline, the pair found support within this zone and has since shown a bullish push, indicating renewed buying pressure.

USDJPY LongsPrice ended up taking sell side liquidity first and gave a nice IFVG for longs...making those shorts I called yesterday invalid today!

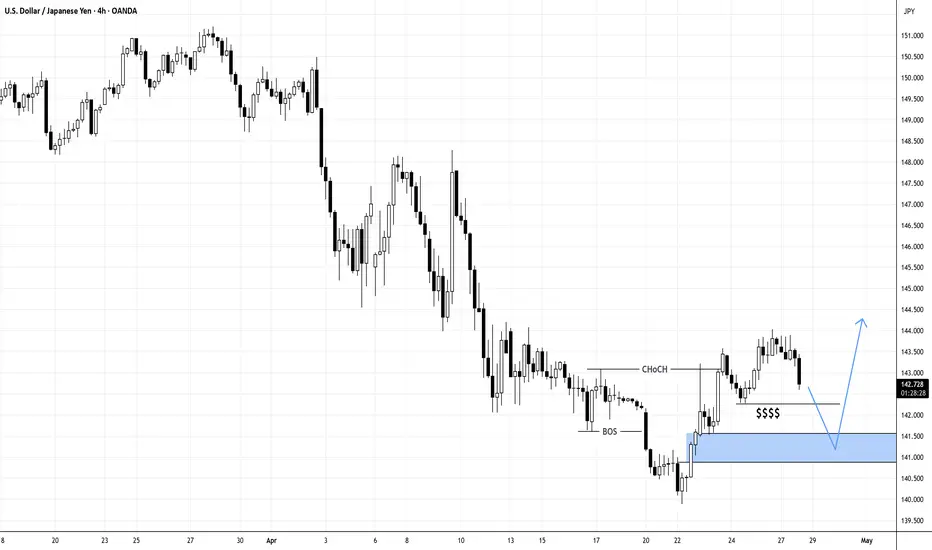
Will USDJPY Shows Reaction Below Liquidity?$$$$
N.B!
- USDJPY price might not follow the drawn lines . Actual price movements may likely differ from the forecast.
- Let emotions and sentiments work for you
- ALWAYS Use Proper Risk Management In Your Trades
#usdjpy
#usd
#jpy
Weekly prediction on USDJPWe are anticipating false week downward direction ,the accumulate orders during the consolidation then after that we move against the false week beginning move come Tuesday or
