USDJPY SELL 4H/1H TradeAm looking for USD Sells as this discounted prices are coming in upside
correlation USD -2D/-5
CORRELATION JPY -2D/+1
I had 3 pair to look for but i saw that AUDUSD was in a range to the upside without any trend and GBPUSD was showing the most strength but its momentum was dying on every move upside and USDJPY came up to be showing strength in opposite where its momentum is off to upside and signs that seller are back in selling. correlation shows that all products are sold off daily but USD is coming from strength and JPY was very weak just coming up to strength.
am watching the upcoming news in New York open and am targeting the lows of the previous range
USDJPY.1000.DUB trade ideas

USDJPY: Analysis daily with me!USD/JPY is rebounding towards 142.50 in Tuesday's Asian session. Improved risk sentiment weakens the safe-haven Yen and supports the US Dollar. However, a Japanese holiday is limiting further upside.

USDJPY: B+ trade → A if clean reversal bar formsA page from my trading journal. Please take it with a grain of salt, as I’m still learning and growing 🌟

USDJPY COT and Liquidity AnalysisCOT Report Analysis:
Consolidatin followed by 3 weeks sell of with the net shorts being added. Price still didn't reach liquidity so in my opinion we have still bearish smart money sentiment. So we got framework and bias now we need to look for setups. Which I will again use my CLS method.
/b]
Hey what up traders welcome to the COT data and Liquidity report. This is a big part of my FX Trading. Im always trying to trade with the Big players so knowing their positions is good thing.
Please be aware that institutions report data to the SEC on Tuesdays and data are reported on Fridays - so again we as retail traders have disadvantage, but there is possibility to read between the lines. Remember in the report is what they want you to see, that's why mostly price reverse on Wednesday after the report so their cards are hidden as long as possible. However if the trend is running you can read it and use for your advantage.
I created this simple free indicator which you can find in the my scripts. It's highlighting the day of the real report - Tuesday.
Here is the tip if the level has confluence with the high volume on COT it can be strong support / Resistance.
Analysis done on the Tradenation Charts
Disclosure: I am part of Trade Nation's Influencer program and receive a monthly fee for using their TradingView charts in my analysis.
"Adapt what is useful, reject what is useless, and add what is specifically your own."
— David Perk aka Dave FX Hunter ⚔️

USDJPY My Opinion! SELL!
My dear friends,
My technical analysis for USDJPY is below:
The market is trading on 143.69pivot level.
Bias - Bearish
Technical Indicators: Both Super Trend & Pivot HL indicate a highly probable Bearish continuation.
Target - 141.93
Recommended Stop Loss - 144.60
About Used Indicators:
A pivot point is a technical analysis indicator, or calculations, used to determine the overall trend of the market over different time frames.
Disclosure: I am part of Trade Nation's Influencer program and receive a monthly fee for using their TradingView charts in my analysis.
———————————
WISH YOU ALL LUCK

liquidty hunter down in usdjpyliquidty hunter down in usdjpy . we are now in pullback vision
liquidty hunter down in usdjpy . we are now in pullback vision
liquidty hunter down in usdjpy . we are now in pullback vision
liquidty hunter down in usdjpy . we are now in pullback vision
liquidty hunter down in usdjpy . we are now in pullback vision
put 100$ and risk 10% of the account

USDJPY Analysis week 18🌐Fundamental Analysis
The US Dollar Index (DXY) has recovered to near 99.75 after a correction on Thursday. President Donald Trump said trade talks are progressing well and a deal with Japan is close.
US-China trade relations have been thrown into uncertainty by conflicting statements: Trump said President Xi Jinping called him, while China denied any talks were taking place. Tokyo's April consumer price index (CPI) beat expectations at 3.4%, bolstering expectations that the Bank of Japan (BoJ) will continue to raise interest rates.
🕯Technical Analysis
Prices are heading towards the resistance zone of 144,900, with the possibility of an uptrend resuming. This resistance zone is likely to act as a retest for a rally towards 148,000. Pay attention to the BUY zones of 142,300 and 141,000 for retests of this pair.
📈📉Trading Signals
SELL USDJPY 148.000-148.200 Stoploss 148.500
BUY USDJPY 141.000-140.800 Stoploss 140.500

USDJPY LONGMy expectation is that price retests the OB+ before going to take out the BSL.
What are your thoughts?

buy is coming on USDJPYThe USD/JPY pair recently experienced a bearish movement, which is largely influenced by heightened concerns surrounding the ongoing trade and tariff tensions between the U.S. and its global counterparts. This risk-off sentiment triggered a flight to safe-haven assets, weighing on the pair.
However, price action has now approached a key trendline support zone, which has held firmly in previous sessions. Technical indicators like RSI are also beginning to show signs of bullish divergence, suggesting a potential reversal. If this trendline continues to act as strong support, we may see a bullish bounce from the current level, aligning with the overall ascending trend structure but if the trade break these support zones, then the bearish movement might continues
for now we will be watching for confirmation signals such as bullish candlestick patterns or a break above near-term resistance levels to validate the upward movement.


TOP DOWN ANALYSIS ON USDJPY 4HR TIMFRAME BIASOn the 4hr timeframe, price created divergence right at the major zone indicating reversal and price went further to break the 4hr trendline signaling bullish and rhyming with the monthly/weekly/daily established bullish bias hence we established a possible entry long on the USDJPY pair.

USDJPY - Already Over-Sold!Hello TradingView Family / Fellow Traders. This is Richard, also known as theSignalyst.
📈USDJPY has been overall bearish trading within the falling wedge pattern marked in blue and it is currently hovering around the lower bound of it.
Moreover, the orange zone is a strong weekly support.
🏹 Thus, the highlighted blue circle is a strong area to look for buy setups as it is the intersection of support and lower blue trendline acting as a non-horizontal support.
📚 As per my trading style:
As #USDJPY approaches the blue circle zone, I will be looking for bullish reversal setups (like a double bottom pattern, trendline break , and so on...)
📚 Always follow your trading plan regarding entry, risk management, and trade management.
Good luck!
All Strategies Are Good; If Managed Properly!
~Rich
Disclosure: I am part of Trade Nation's Influencer program and receive a monthly fee for using their TradingView charts in my analysis.

The beginning of the carry trade unwind part 2?If we look at the chart, the current structure looks very similar to what happened right before the market decline in August.
We've formed a head and shoulders (albeit not perfect as it's slanted), and price seems to be breaking down.
If price action accelerates to do downside, it's likely to take the market with it just like it did the last time.
Paying attention to this over the coming weeks.

BOJ Faces Inflation ChallengeThe Japanese yen weakened to around 143 per dollar on Friday, reversing Thursday’s gains as the U.S. dollar rebounded on easing global trade tensions. President Trump reassured markets that U.S.-China trade talks are ongoing, despite China’s denial, and optimism over talks with Japan and South Korea also supported the dollar. Trump also eased monetary policy concerns by clarifying he never intended to remove Fed Chair Jerome Powell.
In Japan, Tokyo’s core inflation rose to 3.4% in April, the highest in two years, posing a challenge for the Bank of Japan as it balances rising inflation with external risks from U.S. tariffs. The BOJ is expected to keep rates steady.
Key resistance is at 144.00, with further levels at 145.90 and 146.75. Support stands at 139.70, followed by 137.00 and 135.00.

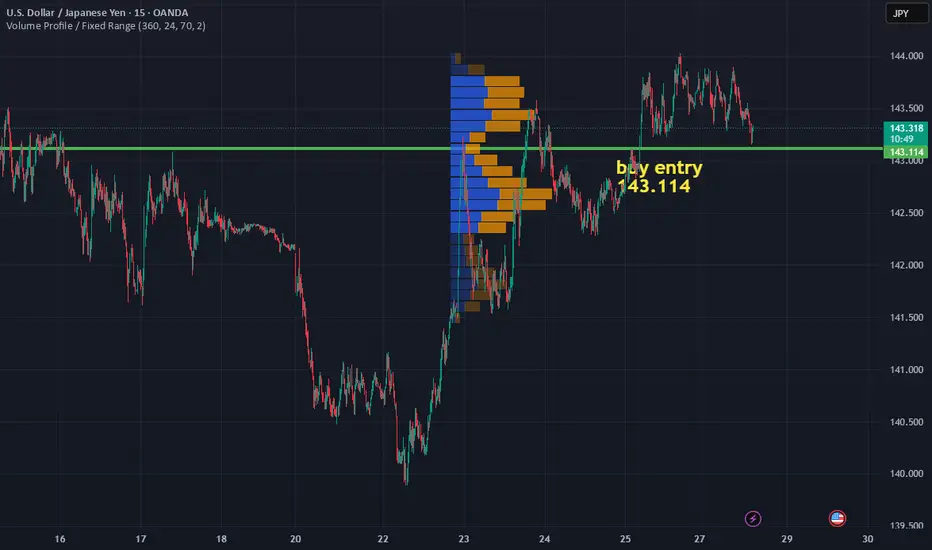
USDJPY: Bulls Eye Key Support as Trade Optimism Lifts DollarHey Traders, We are currently monitoring USDJPY for a potential buying opportunity as price approaches the 143.200 level, an important area that has acted as both support and resistance in recent sessions. Technically, the pair remains in a well-defined uptrend, and this pullback appears to be part of a healthy correction phase rather than a trend reversal. The 143.200 zone also aligns with a dynamic trendline support, increasing the likelihood of a bullish reaction if price holds above this level. From a fundamental perspective, recent developments have started to tilt in favor of the dollar. News of progress toward a trade agreement between the U.S. and India has sparked optimism, as it may lay the groundwork for similar deals with other key global partners. This has been compounded by unconfirmed reports out of China suggesting potential tariff exemptions in specific sectors, which has further boosted investor sentiment and triggered a broader “risk-on” shift in markets. As geopolitical tensions around trade show signs of easing, the U.S. dollar is regaining strength, fueling the case for further upside in USDJPY. Taken together, the convergence of technical support and improving macroeconomic signals presents a compelling opportunity for bulls, provided we see signs of price stability or a confirmed bounce near the 143.200 area.
Trade safe, Joe.

USDJPY Analysis 4H Time-frame Let’s break down the analysis in detail:
---
1. Key Zones & Market Structure
You've identified important supply and demand zones:
Supply Zone (around 158.886):
Price hit this zone and sharply reversed. You've marked it with a yellow box, showing a strong area of sellers.
This is a major resistance zone that was tested twice, forming a possible double top structure.
Demand Zone (around 139.694 - 139.576):
This level previously acted as a strong support.
Price reacted here again, which might indicate bullish interest. You marked this zone well with a yellow box.
---
2. Market Reaction & Rejection Points
In the second image, you circled:
Major highs and lows, showing previous price reactions.
These marks point out liquidity zones—areas where price likely took out stop-losses before reversing.
---
3. Price Action Narrative
Here’s the likely narrative from your analysis:
Uptrend into Supply Zone (158.886) → Rejection → Strong bearish move.
Price finds support in Demand Zone (139.694) → Rejection wick → Signs of a bullish reversal.
Current Price (around 142.9) is pushing back into a potential minor resistance (possibly a breaker or previous support turned resistance around 143–145 zone).
---
4. Timeframes Used
You're using both daily (1D) and 4-hour (4H) timeframes.
The 4H chart helps you zoom into entry confirmations (e.g., rejections, liquidity grabs), while the 1D gives you overall structure and key zones.
---
5. Trade Opportunity Analysis
Based on this, a typical analysis conclusion could be:
> “The price of USD/JPY has reached a significant daily demand zone (around 139.7) where historical price action shows strong buying interest. Price has formed a potential higher low and is showing bullish signs, including a strong rejection wick and a recovery back above minor resistance. If price breaks and holds above the 143–145 zone, the next target could be the mid-resistance at 154.793, and eventually retest the supply zone around 158.886, depending on macro conditions and momentum.”

USDJPY Buy UpdateUSDJPY Buyers stepping in fully...
Analyzing the information from what the yearly candle printed a strong buy is building up at these level

USDJPY sell, Disclaimer:
Trading involves risk. These signals are for informational purposes only and do not constitute financial advice. Past performance is not indicative of future results. Use at your own risk. Always trade responsibly.

USD/JPY(20250429)Today's AnalysisMarket news:
The U.S. Treasury Department raised its second quarter debt forecast to $514 billion. U.S. Treasury Secretary: The "X Day" for the debt ceiling issue will be announced soon.
Technical analysis:
Today's long-short boundary:
142.62
Support and resistance levels:
144.52
143.81
143.35
141.89
141.43
140.72
Trading strategy:
If the price breaks through 142.62, consider buying, the first target price is 143.35
If the price breaks through 141.89, consider selling, the first target price is 141.43

USDJPY H4 I Bullish Rise Based on the H4 chart analysis, we can see that the price has just bounced off our buy entry at 142.09, which is an overlap support that aligns close to the 50% Fibo retracement.
Our take profit will be at 144.01, which is an overlap resistance level.
The stop loss will be placed at 140.89, which is a pullback support level.
High Risk Investment Warning
Trading Forex/CFDs on margin carries a high level of risk and may not be suitable for all investors. Leverage can work against you.
Stratos Markets Limited (tradu.com):
CFDs are complex instruments and come with a high risk of losing money rapidly due to leverage. 63% of retail investor accounts lose money when trading CFDs with this provider. You should consider whether you understand how CFDs work and whether you can afford to take the high risk of losing your money.
Stratos Europe Ltd (tradu.com):
CFDs are complex instruments and come with a high risk of losing money rapidly due to leverage. 63% of retail investor accounts lose money when trading CFDs with this provider. You should consider whether you understand how CFDs work and whether you can afford to take the high risk of losing your money.
Stratos Global LLC (tradu.com):
Losses can exceed deposits.
Please be advised that the information presented on TradingView is provided to Tradu (‘Company’, ‘we’) by a third-party provider (‘TFA Global Pte Ltd’). Please be reminded that you are solely responsible for the trading decisions on your account. There is a very high degree of risk involved in trading. Any information and/or content is intended entirely for research, educational and informational purposes only and does not constitute investment or consultation advice or investment strategy. The information is not tailored to the investment needs of any specific person and therefore does not involve a consideration of any of the investment objectives, financial situation or needs of any viewer that may receive it. Kindly also note that past performance is not a reliable indicator of future results. Actual results may differ materially from those anticipated in forward-looking or past performance statements. We assume no liability as to the accuracy or completeness of any of the information and/or content provided herein and the Company cannot be held responsible for any omission, mistake nor for any loss or damage including without limitation to any loss of profit which may arise from reliance on any information supplied by TFA Global Pte Ltd.
The speaker(s) is neither an employee, agent nor representative of Tradu and is therefore acting independently. The opinions given are their own, constitute general market commentary, and do not constitute the opinion or advice of Tradu or any form of personal or investment advice. Tradu neither endorses nor guarantees offerings of third-party speakers, nor is Tradu responsible for the content, veracity or opinions of third-party speakers, presenters or participants.

USDJPY InsightHello to all our subscribers!
Please share your personal opinions in the comments. Don’t forget to hit the booster and subscribe!
Key Points
- Former U.S. Treasury Secretary Scott Bessent said in an interview with CNBC, “Since China exports five times more to the U.S. than the U.S. does to China, I believe the easing of tensions is up to China.”
- Chinese Foreign Ministry spokesperson Guo Jia-kun denied Trump’s claim of a phone call with President Xi Jinping, saying, “As far as I know, there has been no phone call between the two leaders.”
- The Dallas Federal Reserve reported that the general business activity index for Texas manufacturing in April plunged by 19.5 points from the previous month to -35.8. The U.S. Treasury also announced that, excluding the impact of the debt ceiling, its second-quarter borrowing estimate would be $53 billion lower than previously forecast.
Key Economic Events This Week
+ April 29: U.S. March JOLTS Report
+ April 30: Germany Q1 GDP, Germany April Consumer Price Index, U.S. April ADP Non-Farm Employment Change, U.S. March Core PCE Price Index
+ May 1: Bank of Japan Interest Rate Decision
+ May 2: Eurozone April Consumer Price Index, U.S. April Non-Farm Payrolls, U.S. April Unemployment Rate
USDJPY Chart Analysis
The price rose up to the 144 level but faced resistance in that zone as expected. In the short term, a small range between 140 and 144 is likely to form. With the current pullback, we expect a retest of the support level near 140. If this level holds, another upward move toward 144 can be anticipated. The future direction will be determined by whether the pair breaks out of this range to the upside or downside.

UsdjpyPrise was moving on a rising wedge and got a strong support level which turned into resistance
