USDJPY.1000.DUB trade ideas

USDJPY On The Verge Of A CollapseA simple trade setup with good risk/reward but with huge economic implications should this structure CRACK!
With all H&S patterns, the risk is that it head tests before breaking down.
We've seen this play out recently in NFLX
That is why it is important to wait for the CRACK! And not front-run the trade.

USDJPY Hello, traders
Although the main trend remains bearish with targets at 138.70, 136.15, and potentially lower,
a temporary bullish correction is expected.
Short-term bullish targets:
144.76
146.87
With a lower probability:
148.24

Trade news gradually improves - Supporting USD to rise again🔔🔔🔔 USD/JPY news:
➡️ The USD/JPY pair extended its gains to approach the 144.00 level early Friday, driven by renewed demand for the U.S. dollar following a Bloomberg report suggesting that China is considering suspending the 125% tariff on certain U.S. imports. The pair largely ignored Tokyo’s hotter-than-expected CPI inflation data.
Personal opinion:
➡️ USD/JPY continues to rise thanks to positive news from the Trump administration’s negotiations with Asian countries. Although good Japanese economic data supports the JPY, the focus is still on the active trade war and it supports the USD
➡️ Analysis based on important resistance - support and Fibonacci levels combined with EMA to come up with a suitable strategy
Personal plan:
🔆Price Zone Setup:
👉Buy USD/JPY 143.00 - 144.40
❌SL: 142.50 | ✅TP: 143.80 - 144.40
FM wishes you a successful trading day 💰💰💰

USDJPY 1H FORECASTHello guys, I hope you are well let me tell you that for now we will hold until the Bullish OB and after that we will buy from here and our target will remain the resistance.This is our weekly outlook, not a signal setup.

UJ Possible quick scalp to the upsideAs price forms this ltf Uptrend we can possibly get in with a buy stop
order above the correction

USDJPY – Searching for a Bottom After a Brutal DropSince the start of the year, USDJPY has been in an almost free fall, losing nearly 2,000 pips and breaking multiple key supports, including the critical 150 level.
Yesterday, we even saw a spike below 140, a level not touched for quite some time.
🔄 However, after that spike, the pair reversed sharply to the upside, showing strong demand in that area.
Interestingly, this zone was tested at the start of 2024 and again back in September, adding even more technical relevance.
📊 Despite the poor outlook for the USD overall, I now expect a meaningful rebound from here, aiming for a retest of the former 146 support, which has now turned into resistance.
💡 Trading Plan:
I will be looking to buy dips near the current support, targeting a 1:3 Risk/Reward setup toward the 146 resistance area.
Disclosure: I am part of Trade Nation's Influencer program and receive a monthly fee for using their TradingView charts in my analyses and educational articles.

USDJPY Buy analysisIn the Daily timeframe, we are at a very strong key level, and the price was bouncing. In the 4-hour timeframe, I have the minimum requirement for an uptrend to form, and my trendline is broken.
full explanation in the video.

Bullish Movement loading We might go Bullish after breaking that trend & resistance which will be out support after,the main is to wait for break out & retest and continue shooting upwards

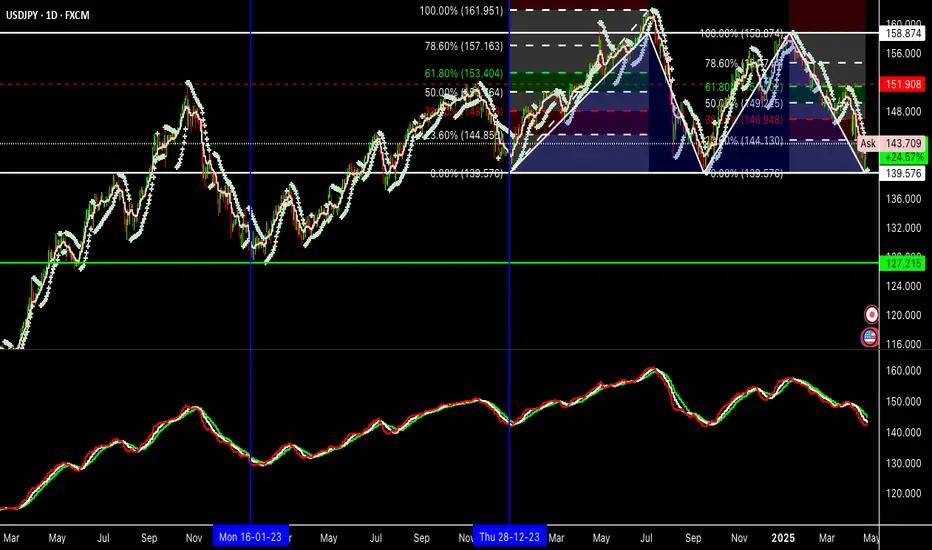
The Consolidation Zone and the UncertaintyIn this trade, I’m going to enter with a short position.
Analyzing the pair on the higher time-frames, it has reached a reversal zone for the second time, previously located around the 158.874 price level.
Moving to the daily time-frame and after the pair hit that same area twice again, there’s the possibility of opening a sell position — but a few points should be considered:
**1st point: Pay attention to the reversal the pair is currently making after reaching the area near 139.576 *and try to understand whether a future pullback might occur, which would strengthen the case for the sell (a Fibonacci tool can be used as support for this).
*Something similar happened between January 16, 2023 and December 28, 2023.
**There’s also the chance that the pair might continue its downward movement without making a reversal or pullback.
2nd point: There’s also a possibility that the pair is in a consolidation zone and could later make a strong bullish move, breaking through the reversal zone around 158.874 and invalidating the selling opportunity.
Taking everything mentioned above into account — and despite the uncertainty around this pair’s future movement — it’s possible to consider both buying and selling at different moments. That’s why it’s important to closely monitor all the movements and try to time it right, because I believe that when the pair chooses a direction, it’ll move with strength.
In this analysis, several moving averages and a Parabolic SAR were also used, and they should be given close attention.
TOP DOWN ANALYSIS ON USDJPY DAILY BIASOn the Daily timeframe, price reacted to the major zone and reversed upwards, rhyming with the established bullish bias on the monthly/weekly timeframe, price is currently sitting on the daily trend line almost broken but we will head to the 4hr timeframe for further confirmation.

Potential bullish rise?USD/JPY has reacted off the support level which is a pullback support that lines up with the 38.2% Fibonacci retracement and could rise from this level to our take profit.
Entry: 142.39
Why we like it:
There is a pullback support level that aligns with the 38.2% Fibonacci retracement.
Stop loss: 140.91
Why we like it:
There is a pullback support level that is slightly above the 78.6% Fibonacci retracement.
Take profit: 144.32
Why we like it:
There is a pullback resistance level that is slightly above the 50% Fibonacci retracement.
Enjoying your TradingView experience? Review us!
Please be advised that the information presented on TradingView is provided to Vantage (‘Vantage Global Limited’, ‘we’) by a third-party provider (‘Everest Fortune Group’). Please be reminded that you are solely responsible for the trading decisions on your account. There is a very high degree of risk involved in trading. Any information and/or content is intended entirely for research, educational and informational purposes only and does not constitute investment or consultation advice or investment strategy. The information is not tailored to the investment needs of any specific person and therefore does not involve a consideration of any of the investment objectives, financial situation or needs of any viewer that may receive it. Kindly also note that past performance is not a reliable indicator of future results. Actual results may differ materially from those anticipated in forward-looking or past performance statements. We assume no liability as to the accuracy or completeness of any of the information and/or content provided herein and the Company cannot be held responsible for any omission, mistake nor for any loss or damage including without limitation to any loss of profit which may arise from reliance on any information supplied by Everest Fortune Group.

USDJP WEEKLY UPDATESHello folks, if you're following
this idea since, then the higher chances are, you win the trade on my short idea before.
Now I'm expecting lows again, This idea is on weekly gap to be filled.
Chart are on 4HTF. this idea are on weekly.
It might retrace, but the weekly timeframe still on bearish.+
This is not a financial advice, follow for more.


USDJPY Possible SellUSDJPY has a high probability to do down and reach liquidity therefore a sell entry is possible on pullback up .
Good LUck


Bullish bounce off 50% Fibonacci support?USD/JPY is falling towards the pivot and could bounce to the pullback resistance.
Pivot: 141.82
1st Support: 140.15
1st Resistance: 144.52
Risk Warning:
Trading Forex and CFDs carries a high level of risk to your capital and you should only trade with money you can afford to lose. Trading Forex and CFDs may not be suitable for all investors, so please ensure that you fully understand the risks involved and seek independent advice if necessary.
Disclaimer:
The above opinions given constitute general market commentary, and do not constitute the opinion or advice of IC Markets or any form of personal or investment advice.
Any opinions, news, research, analyses, prices, other information, or links to third-party sites contained on this website are provided on an "as-is" basis, are intended only to be informative, is not an advice nor a recommendation, nor research, or a record of our trading prices, or an offer of, or solicitation for a transaction in any financial instrument and thus should not be treated as such. The information provided does not involve any specific investment objectives, financial situation and needs of any specific person who may receive it. Please be aware, that past performance is not a reliable indicator of future performance and/or results. Past Performance or Forward-looking scenarios based upon the reasonable beliefs of the third-party provider are not a guarantee of future performance. Actual results may differ materially from those anticipated in forward-looking or past performance statements. IC Markets makes no representation or warranty and assumes no liability as to the accuracy or completeness of the information provided, nor any loss arising from any investment based on a recommendation, forecast or any information supplied by any third-party.

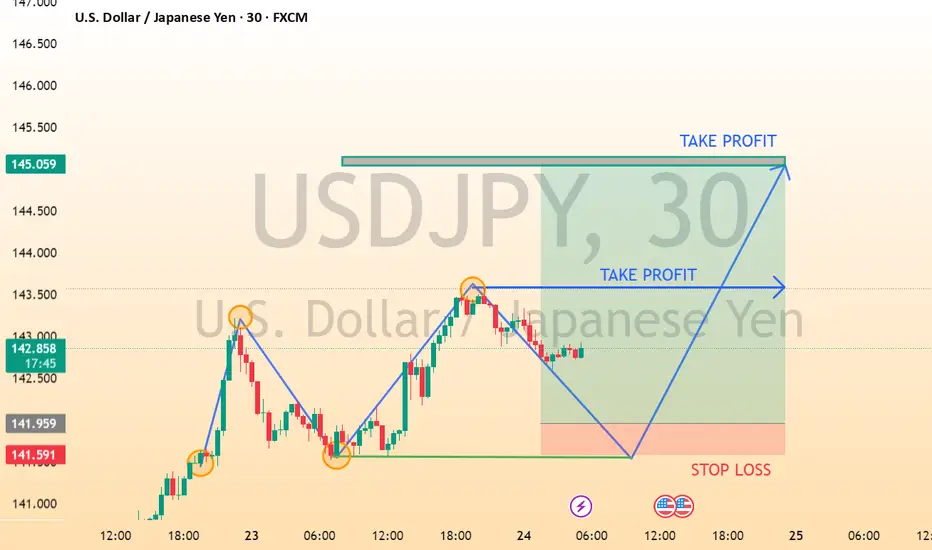
USDJPY 30M CHART PATTERNThis chart shows a potential "W" or double-bottom pattern forming on the USD/JPY 30-minute timeframe, indicating a possible bullish reversal setup.
Key observations:
Pattern Setup: The "W" pattern suggests price might retest the previous low and then bounce up.
Entry Zone: The potential buy zone is near the bottom of the right leg of the "W" (around the green support line).
Stop Loss: Positioned just below the recent low to manage risk.
Take Profit: Two targets are indicated:
The first around the middle horizontal resistance (interim TP).
The second at the previous swing high (full TP).
It looks like a long (buy) trade idea with a solid risk-reward ratio. Are you planning to enter this setup or just analyzing it for now?
See short position In this trading scenario, we observe that the price has not yet reached its valid support and resistance zone, and we anticipate a potential bearish reversal (price drop)

USDJPY buy setup H4Hello! Friends,
Greetings. Please leave a Like if you like the idea.
Before start talking about technical Let's share your LOVE by giving me LIKES to support this work. Thanks in advance.

EUR/NZD Short and USD/JPY ShortEUR/NZD Short
Minimum entry requirements:
• Corrective tap into area of value.
• 4H risk entry or 1H risk entry after 2 x 1H rejection candles.
Minimum entry requirements:
• Tap into area of value.
• 1H impulse down below area of value.
• If tight non-structured 5 min continuation follows, reduced risk entry on the break of it.
• If tight structured 5 min continuation follows, reduced risk entry on the break of it or 5 min risk entry within it.
• If tight non-structured 15 min continuation follows, 5 min risk entry within it if the continuation is structured on the 5 min chart or reduced risk entry on the break of it.
• If tight structured 15 min continuation follows, reduced risk entry on the break of it or 15 min risk entry within it.
USD/JPY Short
Minimum entry requirements:
• Tap into area of value.
• 1H impulse down below area of value.
• If tight non-structured 5 min continuation follows, reduced risk entry on the break of it.
• If tight structured 5 min continuation follows, reduced risk entry on the break of it or 5 min risk entry within it.
• If tight non-structured 15 min continuation follows, 5 min risk entry within it if the continuation is structured on the 5 min chart or reduced risk entry on the break of it.
• If tight structured 15 min continuation follows, reduced risk entry on the break of it or 15 min risk entry within it.

USDJPY 1 Hour Timeframe Impulsive Upwave, Break of StructureUSDJPY is potentially ready for the long term upwave. In the 1 hour timeframe, the last impulse broke the previous structure. Waiting on the formation of corrective structure before trading the next upwave.
