Trend Exhaustion SignalsTrend Exhaustion Signals: How to Know When a Trend is Losing Steam
Every trend eventually runs out of fuel. Knowing when momentum is fading can give you the edge to exit early, avoid late entries, or even prepare for a reversal. This article dives into key signs of trend exhaustion and how to tra

#USDJPY: 2050+ Pips Swing Buy| Trend Confirmed| Comment Views? **FX:USDJPY** A significant market movement has confirmed, indicating the potential for a substantial bullish swing that could reach approximately 2050 pips. Three targets have been identified, allowing you to select the one that aligns best with your analysis. The primary catalyst for this move is

USD/JPY) bullish trend analysis Read The ChaptianSMC Trading point update
Technical analysis of USD/JPY chart shows a bullish reversal setup. Here’s a breakdown behind the analysis:
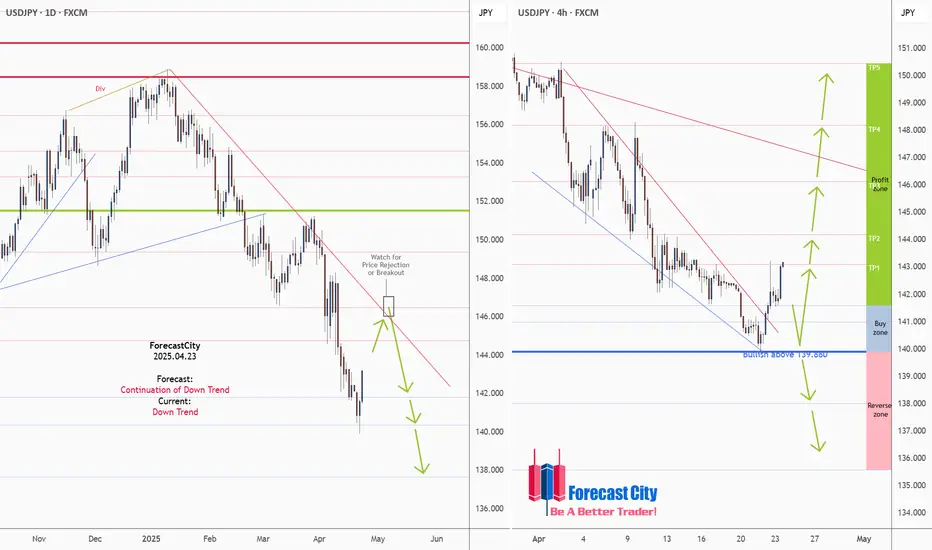
1. Downtrend & Channel Breakout:
Price was trending downward within a descending channel (marked “channel trend”).
Recently, the price broke out of the channel,

USDJPY at a Crossroads: Resistance Held, But What’s Ahead?USDJPY at a Crossroads: Resistance Held, But What’s Ahead?
In our previous analysis, USDJPY respected the resistance zone near 144.40, and the price has already reached our first target.
The trade situation between the US and Japan remains uncertain, which could keep USDJPY under pressure. Japane

USDJPY BULLISH OR BEARISH DETAILED ANALYSISUSDJPY has just completed a clean breakout above a well-defined descending channel on the 4H chart, signaling the beginning of a short-term bullish wave. This move reflects a technical shift in sentiment as buyers reclaim control after weeks of selling pressure. The breakout candle closed above the

USDJPY Daily & H4 Forecasts, Technical Analysis & Trading IdeaTechnical analysis is on the chart!
No description needed!
FX:USDJPY
________________________________________________________________
❤️ If you find this helpful and want more FREE forecasts in TradingView,
. . . . . . . . Hit the 'BOOST' button 👍
. . . . . . . . . . . Drop some feedback in th
USDJPY Potential DownsidesHey Traders, in today's trading session we are monitoring USDJPY for a selling opportunity around 141.600 zone, USDJPY is trading in downtrend and currently is in a correction phase in which it is approaching the trend at 141.600 support and resistance area.
Trade safe, Joe.

USDJPY – Strong Bounce Incoming from Key Support?Price has tapped into a major support zone that’s held strong since early 2024. With confluence from the Fibonacci 0.618–0.65 retracement overhead, we could see a sharp bullish reversal targeting that region.
🟧 Strong support – historically reactive
📈 Potential bullish reversal in play

USDJPY – Searching for a Bottom After a Brutal DropSince the start of the year, USDJPY has been in an almost free fall, losing nearly 2,000 pips and breaking multiple key supports, including the critical 150 level.
Yesterday, we even saw a spike below 140, a level not touched for quite some time.
🔄 However, after that spike, the pair reversed sharp

USD/JPY : Bull or Bear? Let's See! (READ THE CAPTION)Upon reviewing the USD/JPY chart on the daily timeframe, we observe that due to the sharp drop in the Dollar Index, the price has reached the 140.850 level. This decline was very strong and impulsive; however, as seen on the chart, the price has now approached a significant demand zone between 139.6

See all ideas
Summarizing what the indicators are suggesting.
Oscillators
Neutral
SellBuy
Strong sellStrong buy
Strong sellSellNeutralBuyStrong buy
Oscillators
Neutral
SellBuy
Strong sellStrong buy
Strong sellSellNeutralBuyStrong buy
Summary
Neutral
SellBuy
Strong sellStrong buy
Strong sellSellNeutralBuyStrong buy
Summary
Neutral
SellBuy
Strong sellStrong buy
Strong sellSellNeutralBuyStrong buy
Summary
Neutral
SellBuy
Strong sellStrong buy
Strong sellSellNeutralBuyStrong buy
Moving Averages
Neutral
SellBuy
Strong sellStrong buy
Strong sellSellNeutralBuyStrong buy
Moving Averages
Neutral
SellBuy
Strong sellStrong buy
Strong sellSellNeutralBuyStrong buy
Displays a symbol's price movements over previous years to identify recurring trends.
Related currencies
Frequently Asked Questions
The current rate of USDJPY_LMAX is 143.685 JPY — it has increased by 0.50% in the past 24 hours. See more of USDJPY_LMAX rate dynamics on the detailed chart.
The value of the USDJPY_LMAX pair is quoted as 1 USD per x JPY. For example, if the pair is trading at 1.50, it means it takes 1.5 JPY to buy 1 USD.
The term volatility describes the risk related to the changes in an asset's value. USDJPY_LMAX has the volatility rating of 1.03%. Track all currencies' changes with our live Forex Heatmap and prepare for markets volatility.
The USDJPY_LMAX showed a 0.64% rise over the past week, the month change is a −4.39% fall, and over the last year it has decreased by −7.67%. Track live rate changes on the USDJPY_LMAX chart.
Learn how you can make money on rate changes in numerous trading ideas created by our community.
Learn how you can make money on rate changes in numerous trading ideas created by our community.
USDJPY_LMAX is a major currency pair, i.e. a popular currency paired with USD.
Currencies are usually traded through forex brokers — choose the one that suits your needs and go ahead. You can trade USDJPY_LMAX right from TradingView charts — just log in to you broker account. Check out the list of our integrated brokers and find the best one for your needs and strategy.
When deciding to buy or sell currency one should keep in mind many factors including current geopolitical situation, interest rates, and other. But before plunging into a deep research, you can start with USDJPY_LMAX technical analysis. The technical rating for the pair is sell today, but don't forget that markets can be very unstable, so don't stop here. According to our 1 week rating the USDJPY_LMAX shows the sell signal, and 1 month rating is sell. See more of USDJPY_LMAX technicals for a more comprehensive analysis.