Not enough strengthNot enough strength for a break up of the descending channel. I think is going to be rejects again and drop to the bottom of the channel. Be careful of a fake out, SL triggers only if a daily candle closes above the resistance.
USDJPY_LMAX trade ideas

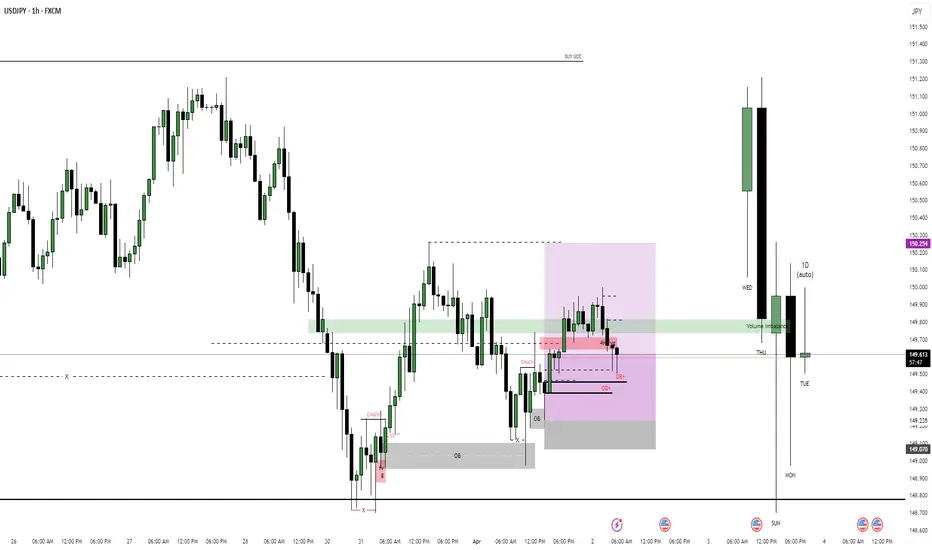
USD/JPY Bearish Reversal Amid Structural ShiftDisclaimer: This is not professional financial advice; it is purely my personal opinion. Please consult a qualified financial expert before making any trading decisions.
Initially, I planned to go long on USD/JPY based on the bullish momentum observed in the 4-hour time frame. However, the external structural high struggled to break, signalling potential weakness. Soon after, price action began forming lower lows, confirming a shift in structure to the downside.
A solid change of character (ChoCh) occurred following a liquidity sweep on the opposite side of the chart, reinforcing the bearish outlook. Given this shift, I adapted my strategy accordingly, favouring a short position.
Additionally, unexpected news from the Eurozone impacted USD pairs, accelerating price movements beyond my anticipated entry. This volatility was likely driven by macroeconomic factors, including a Dow Jones report on tariffs that may have influenced broader USD sentiment.
Key Takeaways:
Bearish Structural Shift – Lower lows formed after failure to break external structural highs.
Change of Character (ChoCh) – Liquidity sweep indicated a momentum shift.
Fundamental Influence – News from the Eurozone and tariff-related updates impacted USD pairs.
I'll be monitoring further price action to confirm bearish continuation and potential re-entry points.
#USDJPY #Forex #PriceAction #LiquiditySweep #MarketStructure

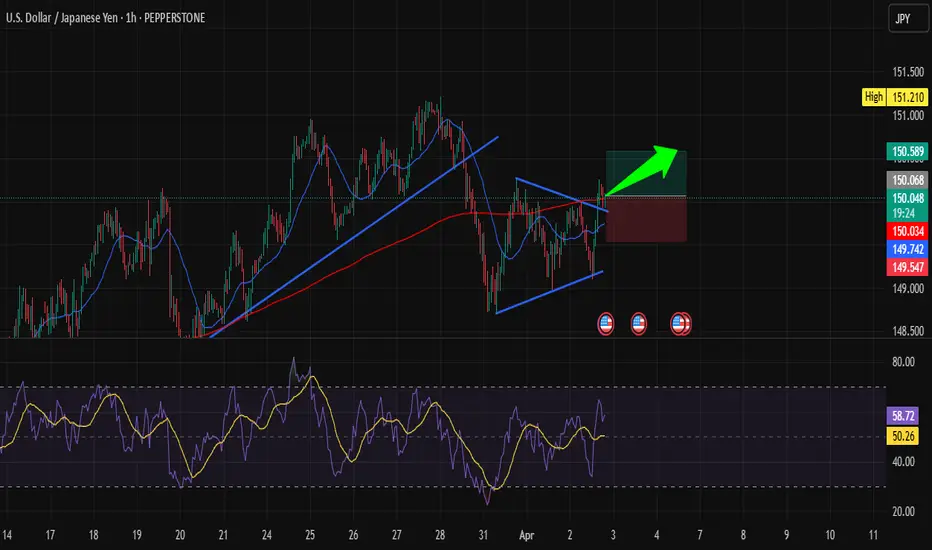
USD/JPY Ready to Take Off: Golden Opportunity on 1H!Hi traders! Analyzing USD/JPY on the 1H timeframe, spotting a potential entry:
🔹 Entry: 150.08
🔹 TP: 150.589
🔹 SL: 149.547
USD/JPY is breaking out of a bullish pennant pattern, suggesting a potential upward move. The RSI is holding above 50, indicating bullish momentum building up. If the price sustains above 150.08, we could see a push toward 150.589. Keep your eyes on price action and manage your risk!
⚠️ DISCLAIMER: This is not financial advice. Trade responsibly.
UJ continuation?as said, prev sessions high are taken out but price hasnt taken out the POI (PDH)
OB identified SM buys? cant say as this is just my view 30 pips target
if u missed early buy u can hop on the continuation until prev day is taken nevertheless trade with caution. Tradingview wont let me publish 5min so i made a video.. wait mss now weve experienced an LQ sweep + inducement.
drop your view

JPY/USD: Bearish Triangle Pattern Breakout Towards TargetChart Pattern: Triangle Pattern
Pattern Description
Type: The chart identifies a Triangle Pattern, which is a type of consolidation pattern that can act as either a continuation or reversal pattern depending on the preceding trend and the breakout direction. Triangles are characterized by converging trendlines, indicating a period of indecision in the market as the price range narrows.
Specific Type: This appears to be a Symmetrical Triangle, as the upper and lower trendlines converge at a similar angle, suggesting neither buyers nor sellers have clear control during the consolidation phase.
Appearance on the Chart:
The Triangle Pattern is marked with two converging trendlines:
Upper Trendline (Resistance): Connects the lower highs, sloping downward.
Lower Trendline (Support): Connects the higher lows, sloping upward.
The pattern began forming around March 27, after a sharp downtrend, and continued until the breakout on April 2, 2025.
Breakout Direction:
Symmetrical Triangles can break out in either direction, but they often continue the preceding trend. In this case, the preceding trend was bearish (a sharp decline from 0.006720 to 0.006640), and the breakout is to the downside, confirming a bearish continuation.
The chart shows the price breaking below the lower trendline of the triangle around April 2, 2025, with a strong bearish candle, indicating a confirmed bearish breakout.
Key Levels and Trading Setup
1. Support Level
A horizontal support zone is marked around 0.006640 (approximately 0.00664–0.00665).
This level acted as a base during the triangle formation, with the price bouncing off this zone multiple times (e.g., on March 28 and March 31).
The price has now broken below this support, turning it into a resistance level on any potential retest.
2. Resistance Level
A resistance zone is marked around 0.006705 (approximately 0.00670–0.00671).
This level corresponds to a previous high within the triangle and aligns with the upper boundary of the triangle at the time of the breakout.
After the breakout, this resistance level is where the stop loss is placed, as a move back above this level would invalidate the bearish setup.
3. Target
The target for the breakout is projected at 0.006599 (approximately 0.00660).
This target is likely calculated by measuring the height of the triangle at its widest point (from the highest high to the lowest low within the pattern) and projecting that distance downward from the breakout point.
The chart indicates a potential move of -0.000604 (-0.96%), which aligns with the distance from the breakout level (around 0.006654) to the target (0.006599).
4. Stop Loss
A stop loss is suggested above the resistance level at 0.006705.
This placement ensures that if the breakout fails and the price moves back above the triangle’s lower trendline (now acting as resistance), the trade is exited with a manageable loss.
Trading Setup Summary
Entry:
The setup suggests entering a short (sell) position after the price breaks below the lower trendline of the Triangle Pattern, which occurred around April 2, 2025. The breakout is confirmed by a strong bearish candle closing below the trendline at approximately 0.006654.
Stop Loss:
Place a stop loss above the resistance level at 0.006705 to protect against a false breakout or reversal. The distance from the breakout level (0.006654) to the stop loss (0.006705) is 0.000051, representing the risk on the trade.
Take Profit/Target:
Aim for the target at 0.006599, which is the projected price objective based on the triangle’s height. The distance from the breakout level to the target is 0.000055, or a 0.96% move.
Risk-Reward Ratio:
The risk is 0.000051 (from 0.006654 to 0.006705), and the reward is 0.000055 (from 0.006654 to 0.006599), giving a risk-reward ratio of approximately 1:1.08 (0.000055 / 0.000051). While this ratio is slightly above 1:1, it’s on the lower side for a typical trading setup, so traders should ensure high confidence in the breakout.
Additional Observations
Price Action Context:
Before the triangle formed, the price experienced a sharp decline from 0.006720 (March 23) to 0.006640 (March 27), indicating a strong bearish trend.
The triangle represents a consolidation phase within this downtrend, and the downside breakout suggests a continuation of the bearish momentum.
Volume and Momentum:
The chart doesn’t display volume or momentum indicators (e.g., RSI, MACD). However, a typical confirmation of a triangle breakout would include:
An increase in volume on the breakout candle, indicating strong selling pressure.
Bearish momentum signals, such as an RSI below 50 or a bearish MACD crossover.
Traders might want to check these indicators for additional confirmation of the breakout’s strength.
Timeframe:
This is a 1-hour chart, so the setup is intended for short-term trading, with the target potentially being reached within a few hours to a day.
Market Context:
USD/JPY is influenced by factors like U.S. dollar strength, Japanese yen safe-haven demand, and interest rate differentials. A bearish move in USD/JPY could be driven by a stronger yen (e.g., due to risk-off sentiment) or a weaker dollar (e.g., due to dovish U.S. economic data).
Conclusion
The TradingView idea presents a bearish setup for USD/JPY based on a Symmetrical Triangle Pattern on the 1-hour chart. The price has broken below the triangle’s lower trendline, confirming a bearish continuation with a target of 0.006599. The setup includes a stop loss at 0.006705 to manage risk, offering a risk-reward ratio of approximately 1:1.08. Key levels to watch include the former support (now resistance) at 0.006640 and the resistance at 0.006705. Traders should consider additional confirmation from volume and momentum indicators, as well as broader market conditions, before executing the trade. Since this chart is from April 2, 2025, market conditions may have evolved, and I can assist with searching for more recent data if needed!

TRADING PLAN: USDJPY LONG TRADE SETUP Given the bullish sentiment in UJ today, and the successful liquidity grab at the London session low, we'll take a long position. Our initial target is a 1:1 risk-reward ratio, followed by a 1:2 ratio after securing some profits.

USDJPY NEXT MOVE Support Breakdown:
The analysis assumes that the price will respect the support level and bounce back up. However, if the support at around 149.000 is broken, we might see a further decline rather than a bullish reversal.
2. False Breakout at Resistance:
The target suggests a move toward 151.000 resistance. However, price might fail to break above resistance and reverse back down, trapping buyers in a bull trap.
3. Sideways Movement (Consolidation):
The price may not follow the expected movement and could enter a range-bound phase, moving sideways between support and resistance.
4. Fundamental Factors:
Unexpected economic news, central bank intervention, or geopolitical events could disrupt the technical setup, leading to an outcome that does not follow the projected path.

USDJPY: Long Signal with Entry/SL/TP
USDJPY
- Classic bullish setup
- Our team expects bullish continuation
SUGGESTED TRADE:
Swing Trade
Long USDJPY
Entry Point - 149.48
Stop Loss - 148.96
Take Profit - 150.43
Our Risk - 1%
Start protection of your profits from lower levels
Disclosure: I am part of Trade Nation's Influencer program and receive a monthly fee for using their TradingView charts in my analysis.
❤️ Please, support our work with like & comment! ❤️

USDJPY DOWNWARDhello fellow traders, we wait for another down/retracements on this pair FX:USDJPY , but this is only my view, you can share yours if you have any idea.
1st target 148.6,
Long zone 145 . this idea base on my own understanding, on my other pairs that posted, still valid folks. GU, GJ, XAU. are we all connected?
this is not a financial advice,
follow for more swing trades. swing it....

USDJPY INTRADAY capped bearish below 151.20 awaits tariff dataThe USDJPY currency pair remains in a bearish trend, with the recent price action showing signs of an oversold bounce. While a temporary rebound is in play, the broader sentiment remains weak unless a decisive breakout occurs.
Key Levels to Watch:
Resistance Levels: 151.21 (critical level), 152.20, 153.04
Support Levels: 149.17, 148.26, 147.22
Bearish Scenario:
A rejection from the 151.21 resistance level could reaffirm the downside bias, leading to a continuation of the bearish move toward 149.17, with extended declines targeting 148.26 and 147.22 over the longer timeframe.
Bullish Scenario:
A breakout above 151.21 with a daily close above this level would challenge the bearish sentiment, opening the door for further gains toward 152.20, followed by 153.04.
Conclusion:
The market sentiment remains bearish, with 151.21 acting as a critical resistance zone. A rejection from this level could reinforce the downtrend, while a confirmed breakout would shift the outlook to bullish, favouring further upside. Traders should closely monitor price action at this key level for confirmation.
This communication is for informational purposes only and should not be viewed as any form of recommendation as to a particular course of action or as investment advice. It is not intended as an offer or solicitation for the purchase or sale of any financial instrument or as an official confirmation of any transaction. Opinions, estimates and assumptions expressed herein are made as of the date of this communication and are subject to change without notice. This communication has been prepared based upon information, including market prices, data and other information, believed to be reliable; however, Trade Nation does not warrant its completeness or accuracy. All market prices and market data contained in or attached to this communication are indicative and subject to change without notice.

USDJPY Short OpportunityPoint and Figure charting is the OG technical analysis method—no fancy candlesticks or bar charts needed. Unlike other charts, Point and Figure ignores time and focuses purely on price action, offering clarity amid market noise.
If candlestick charts look too chaotic for your taste, Point and Figure usually clears things up. Its simplicity is its best feature: fewer patterns and straightforward trade execution rules, compared to the 150+ patterns of Japanese Candlesticks.
On the USDJPY 40-pip/3-box reversal P&F chart, a bear flag pattern is currently being tested and acting as solid resistance. This creates an aggressive but appealing short entry opportunity at 148.80. Below this entry, there are multiple potential profit targets, with T3 (141.60) marking the maximum realistic expectation.
Now, before you get too excited about a single-column collapse from 148.80 down to 141.60—hold your horses. The odds of USDJPY making such a dramatic drop in one swift move are slim to none. But given the current international trade tensions, stranger things have happened.
Think of the area between 148.80 and 141.60 as a zone where it's easier for USDJPY to drift downward rather than grind upward.

USD/JPY : Bulls are coming back?! Let's See! (READ THE CAPTION)Upon analyzing the USD/JPY daily chart, we observe that the price precisely hit our previously forecasted target of 148.65 before declining further to 146.5. Following that, USDJPY rallied back up to 151 and is currently trading around 150.680. Should the price manage to stabilize above 150.5, we can anticipate further gains in this pair. This analysis will be updated accordingly.
Please support me with your likes and comments to motivate me to share more analysis with you and share your opinion about the possible trend of this chart with me !
Best Regards , Arman Shaban

UJ ideaGot an early buy during NY PM and got out before london (asian extension) 50-60 pips once i established the minor bullish order flow.. I have been away dealing with Research stuff. However, I see more push to pre4v days high which is my bias for this week unless suggested otherwise but for now ima take the cake piece by piece. New order block identified and it is suggested smart money are positioned there for more buys LQ needs to be generated. But watch out londons#/NY continuation to tackle previous sessions high (London and Asian) u can use same indicators i use),,, Goodluck guys as this is my only watch for the week...
USDJPY Analysis todayHello traders, this is a complete multiple timeframe analysis of this pair. We see could find significant trading opportunities as per analysis upon price action confirmation we may take this trade. Smash the like button if you find value in this analysis and drop a comment if you have any questions or let me know which pair to cover in my next analysis.

USD/JPY USD/JPY: Possible Continuation of Short Position Towards the 141.38 Area, a Very Important Support Zone.
Why do I think this?
Uncertain Geopolitical Situation, JPY as a Safe-Haven Currency.
Technically, the current price has retested the 150 zone (a significant resistance area) without breaking through it. Looking at higher timeframes, the momentum appears to be bearish.

USDJPY Technical AnalysisFenzoFx—USDJPY tested 150.25, a trading range below this level and the 50-period simple moving average. A close above 150.25 can trigger the uptrend, targeting 151.2.
Conversely, a dip below 148.2 invalidates the bullish outlook, with 148.2 as the first target and 147.43 as the secondary target.

ONENTRYUSD/JPY Asian Range Pullback Strategy
Timeframe: 30 Minutes
Key Session: Asian Market Hours (00:00 - 05:30 +2GMT)
Strategy Rules
1. Identify the Asian Range
Mark the high and low of USD/JPY between 00:00 - 05:30 ( +2GMT )
Only trade if the range is >25pips (avoids noise).
2. Wait for Breakout + Pullback
Breakout: Price must close outside the range (candle body, not wick).
Pullback: Enter on a 50% retracement of the Asian range.
Longs: Breakout above range → buy at 50% pullback.
Shorts: Breakout below range → sell at 50% pullback.
3. Trade Execution
Entry: 50% retracement level of the Asian range.
Stop Loss:
Longs: Below the range low (for breakouts above).
Shorts: Above the range high (for breakouts below).
Take Profit : 1:1 Risk-Reward (RR).
ENTRY 194.82
SL 194.68
TP 194.95

USDJPY Sell nowUSDJPY sell now Setup is drawn based on market could not make HH in the market which is sign that market will restest the Trend support line again. Accordingly TPs and SL is choosen carefully. one should not risk more than 1% in this trade.

USD/JPY 30-Minute Trade Setup: Bullish Reversal from Key SupportEMA (30, close) - Red Line: 149.488 (shorter-term trend)
EMA (200, close) - Blue Line: 149.862 (longer-term trend)
Trade Setup:
Entry Zone: Around 149.000 (marked by the purple support area)
Stop Loss: 148.698 (below the key support level)
Target Point: 150.275 (potential profit level)
Analysis:
Price is currently testing a strong support zone (purple area), suggesting a possible bullish reversal.
The 30 EMA (red) is acting as local resistance.
The 200 EMA (blue) is positioned above, which may act as further resistance if price moves up.
The price action suggests a potential bounce from support, leading to a target around 150.275.
Risk-to-Reward Consideration:
Stop loss is placed slightly below the support zone for risk management.
Target price provides a favorable risk-to-reward ratio of approximately 1:3.
Conclusion:
A long (buy) trade is expected if price holds above the support zone.
If price breaks below 148.698, the bullish setup could be invalidated.
A break above 149.862 (200 EMA) would confirm a stronger bullish continuation.

Fundamental Market Analysis for April 2, 2025 USDJPYThe Japanese Yen (JPY) fails to capitalise on the previous day's modest gains against its US counterpart and attracts fresh sellers during Wednesday's Asian session. The USD/JPY pair, however, remains in the range it has been in since the beginning of this week as traders await a new catalyst before positioning for the next leg of directional movement. As such, attention will remain focused on US President Donald Trump's announcement of retaliatory tariffs later today.
Meanwhile, speculation that the slowdown in the economy caused by the tariffs may force the Bank of Japan (BoJ) to keep policy steady for now is undermining the yen. However, investors seem convinced that the BoJ will continue to raise interest rates amid signs of rising inflation in Japan. This is a significant divergence from the growing confidence that the Federal Reserve (BoJ) will resume its rate-cutting cycle in June, and should support the lower-yielding Japanese Yen.
Trade recommendation: SELL 150.00, SL 150.90, TP 148.60

USD/JPY(20250402)Today's AnalysisToday's buying and selling boundaries:
149.55
Support and resistance levels
150.70
150.27
149.99
149.11
148.83
148.40
Trading strategy:
If the price breaks through 149.99, consider buying, the first target price is 150.27
If the price breaks through 149.55, consider selling, the first target price is 149.11

USDJPY H1 | Bullish Bounce OffBased on the H1 chart analysis, the price is approaching our buy entry level at 149.54, a pullback support that aligns with the 38.2% Fibonacci retracement.
Our take profit is set at 150.36, a pullback resistance that aligns close to the 78.6% Fibonacci retracement.
The stop loss is placed at 148.97, a multi-swing low support.
High Risk Investment Warning
Trading Forex/CFDs on margin carries a high level of risk and may not be suitable for all investors. Leverage can work against you.
Stratos Markets Limited (fxcm.com/uk):
CFDs are complex instruments and come with a high risk of losing money rapidly due to leverage. 63% of retail investor accounts lose money when trading CFDs with this provider. You should consider whether you understand how CFDs work and whether you can afford to take the high risk of losing your money.
Stratos Europe Ltd (fxcm.com/eu):
CFDs are complex instruments and come with a high risk of losing money rapidly due to leverage. 63% of retail investor accounts lose money when trading CFDs with this provider. You should consider whether you understand how CFDs work and whether you can afford to take the high risk of losing your money.
Stratos Trading Pty. Limited (fxcm.com/au):
Trading FX/CFDs carries significant risks. FXCM AU (AFSL 309763), please read the Financial Services Guide, Product Disclosure Statement, Target Market Determination and Terms of Business at fxcm.com/au
Stratos Global LLC (fxcm.com/markets):
Losses can exceed deposits.
Please be advised that the information presented on TradingView is provided to FXCM (‘Company’, ‘we’) by a third-party provider (‘TFA Global Pte Ltd’). Please be reminded that you are solely responsible for the trading decisions on your account. There is a very high degree of risk involved in trading. Any information and/or content is intended entirely for research, educational and informational purposes only and does not constitute investment or consultation advice or investment strategy. The information is not tailored to the investment needs of any specific person and therefore does not involve a consideration of any of the investment objectives, financial situation or needs of any viewer that may receive it. Kindly also note that past performance is not a reliable indicator of future results. Actual results may differ materially from those anticipated in forward-looking or past performance statements. We assume no liability as to the accuracy or completeness of any of the information and/or content provided herein and the Company cannot be held responsible for any omission, mistake nor for any loss or damage including without limitation to any loss of profit which may arise from reliance on any information supplied by TFA Global Pte Ltd.
The speaker(s) is neither an employee, agent nor representative of FXCM and is therefore acting independently. The opinions given are their own, constitute general market commentary, and do not constitute the opinion or advice of FXCM or any form of personal or investment advice. FXCM neither endorses nor guarantees offerings of third-party speakers, nor is FXCM responsible for the content, veracity or opinions of third-party speakers, presenters or participants.

